Download
1 / 71
710 likes | 867 Vues
Strategy for Renewable Electricity in San Diego by 2020. Richard Caputo San Diego Renewable Energy Society Chapter of the American Solar Energy Society 20 Sept 2010. OUTLINE. A Point of View National Level Climate Change Non-Carbon Options Apply to San Diego Energy Tribes

E N D
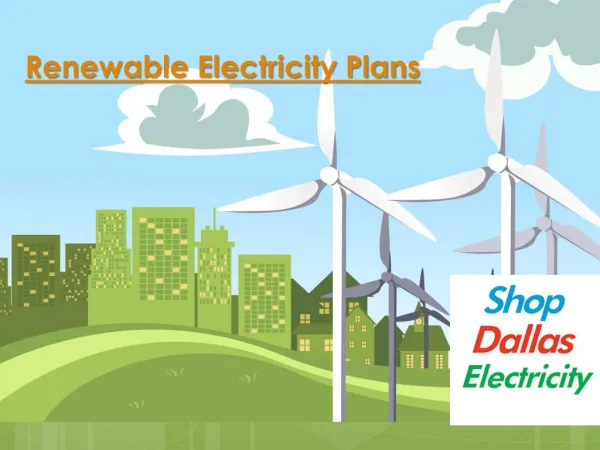
Strategy for Renewable Electricity in San Diego by 2020 Richard Caputo San Diego Renewable Energy Society Chapter of the American Solar Energy Society 20 Sept 2010
OUTLINE • A Point of View • National Level • Climate Change • Non-Carbon Options • Apply to San Diego • Energy Tribes • Goals for Choosing Renewable Energy (RE) • RE Resources Magnitude • Contribution Toward Peaking Needs • RE Cost including Battery Storage • Environmental Characteristics • 2020 RE Projection • Conclusion
APPROACH • Take a Particular But General Point of View About: • Energy • Environment, and • Equity Issues • Identify Some Problems and Develop Solutions • Go Back and Identify Other Points of View • Revaluate the Problem and Solutions
Why This Approach ? • You can’t really talk about what you call a “problem” and what you call a “solution” without talking about different value systems • Some of us may not be disagreeing about technical data but about core values
A Particular Point of View • See the world as controllable • Nature is stable until pushed beyond discoverable limit • Environmental management requires: • certified experts to determine the precise locations of nature’s limits, and • statutory regulation to ensure that all economic activity is kept with those limits • Man is malleable, deeply flawed but redeemable by long-lasting, and trustworthy institutions • Fair distribution is by need, and the need is determined by expert and dispassionate authority
People Causing Rapid Climate Change • Human Driven with 90% Probability ( IPCC,2007) • Carbon Dioxide (CO2) less than 300 ppm for last 650,000 yrs • Since 1750, CO2 from 280 to 380 pp (= + 0.5C) • 100 ppm Swing Is a Large Number • Caused 1 Mile Thick Ice Over Chicago (280 to 180) • Without CO2 Reductions: • Unprecedented Warming with both flood and drought • Large Sea Level Rise • Large-Scale Species Extinctions --up to 80% by 2100 • 100s Millions of Climate Change Refugees
People driven simulations correlate well with observed upper-level ocean temperatures
Who Are Skeptics • Being paid by the fossil industry to introduce “doubt” • Most Who Own or Work in the Fossil Industry • Those Who Feel That Anything That Leads to a Greater Role for Government Should Not Be Supported e.g. smoking causes cancer, humans causing CC, etc • About 30% of U.S. Public Responding to General Media Saying Climate Change Is Due to Natural Variability, Scientists Seeking More Grants, or a Hoax, etc • AAPG(American Asso. of Petroleum Geologists) is the only scientific body of national or international standing known to reject the basic findings of human influence • Independent Skeptics Who Break with Scientific Establishment and Go It Alone, e.g. - Freeman Dyson, Don Rapp, etc
Who Believes Humans Causing CC • IPCC – Intergovernmental Panel on Climate Change Made Up of ~ 2500 Scientists in the Field - 4th Assessment Report finds that human actions are "very likely" (90% probability) the cause of global warming” • Signatories of Kyoto Agreement - 187 Nations Signed and Ratified - 1 Nation Signed but Not Intending to Ratify (U.S.) - 2 Nations Have No Position (Afghanistan & San Marino) • 32 National Science Academies • American Scientific Organizations such as: AAAS, ACS, AGU, AMS, AIP, APS, GSA, IUGG, AMS, AQA, ASM, SAF, AAP, ACPM, AMA, etc.
National Assessment • American Solar Energy Society (www.ases.org) • Reviewed 6 Renewable Energy (RE) Options • Reviewed Energy Efficiency (EE) in All Major Sectors • National Experts Participated • Ground rules: • Identify options • Assess cost in comparison with EIA national cost model with EIA conventional fuels estimates • Consider barriers and impediments • Realistic Projections • Results Added and Compared to CO2 reduction Goals
Contributors for Non-Carbon Sources Buildings: Marilyn Brown, Therese Stovall, and Patrick Hughes (Oak Ridge National Laboratory) Plug-In Hybrid Electric Vehicles: Peter Lilienthal and Howard Brown (National Renewable Energy Laboratory [NREL]) Overall Energy Efficiency: Joel Swisher (Rocky Mountain Institute) Concentrating Solar Power: Mark Mehos (NREL) and David Kearney (Kearney and Associates) Photovoltaics: Paul Denholm and Robert Margolis (NREL) and Ken Zweibel (PrimeStar Solar, Inc.) Wind Power: Michael Milligan (NREL) Biomass: Ralph Overend and Anelia Milbrandt (NREL) Biofuels: John Sheehan (NREL) Geothermal Power: Martin Vorum (NREL) and Jefferson Tester (MIT) Summary/Editor: Charles Kutscher, American Solar Energy Society
U.S. Carbon Emissions2030 Potential (2) Tackling Climate Change
GOOD NEWS • ENERGY EFFICIENCY and RENEWABLE ENERGY CAN REDUCE CARBON EMISSIONS and MEET GOAL for the U.S. AT A REASONABLE COST
Renewable Contributions (2) Tackling Climate Change
Conclusions • Energy Efficiency Could Negate U.S. Emissions Growth • Six Renewables Can Provide Deep Cuts in Emissions • Provide about 50% of total electricity • Provide about 40% of liquid fuels in 2030 • U.S. Has Abundant Renewable Resources Spread Throughout the Country • Wind Can Provide ~1/3 of Renewable Electricity and Remainder Split Evenly Among Other 4 Resources • EE and RE Can Begin Today to Tackle Global Warming • Continued R&D and Policy Support Will Help These Technologies Achieve Their Large Future Potential
Conclusions, continued • 4 of 5 Renewable Electricity Options Depend on Transmission Wires • Wind • CSP • Geothermal • Biomass Electricity • Even On-site PV Depends on Wires in Grid for Back Up • Initially (up to 2025), Wires Bring RE to Regional Loads • Finally ( after about 2025), Wires Needed to Move Electricity to Other Regions • High Voltage DC Transmission Lines • Efficient Lower Cost Long Distance Energy Transfer • Will Enable Renewable Electricity to Exceed 50% and Combined with Additional Efficiency, Attain Further Reduction of Carbon Emissions
??? • Carbon-free Solution Depends on: • Level Playing Field • Discontinue BAU Subsidies to Old Energy • Invest in New Energy • Place Dollar Cost on Carbon Release • Restructure Energy Infrastructure to Work with RE • Rate Structure • Smart Grid • Transmission Lines • Sustaining Support for a Century or More • Cooperating with Other Nations • A Level Playing Field Depends on Citizens Engaging the Political Process
Apply to San Diego Region In the Renewable Energy Electric Sector
Overview of Perceptions and Conflicts Over Energy Issues • Use Cultural Anthropologists “Cultural Bias Theory” As a Framework (1) • Internally Consistent World Views • Enable Efficient Coping Strategies • ENERGY TRIBES in Collision: • Egalitarian • Individualism • Hierarchical • Fatalism
Major RE Power System Goals 1. To Minimize Fossil Fuel Use and/or Expensive Storage: • Sum of Renewables Should Approach Average Capacity Factor of Current SD Grid • San Diego Grid Capacity Factor ~ 0.54 • Currently Is a Combination of Baseload, Intermediate and Peaker Power Plants 2. To Use Lower Cost Options 3. To Be Mindful of RE Impacts 4. To Balance RE Between Region and SD Cty
San Diego Regional Energy • Region is SD Cty, Imperial Cty and Northern Baja • 2003 Study (3) Showed Almost All of Renewable Energy (RE) Available Outside San Diego Cty • About 42 GW out of 47 GW Total Technical Potential • Largest Single Resource Is Desert RE in Imperial Cty • 70% of Total • SANDAG Set Goal of 50% RE from SD Cty • 0ver 60% of Current Electricity from Outside SD Cty • 2006 EWG Study Laid Out Approach to Reach 50% Goal (4)
SD Region RESOURCE MAGNITUDE, MW (5,8,10,11,12) Total = 47 GW 1.5 GW
Summer Peak Winter Peak
Contribution to Peak Power for RE with 500 MW Name Plate Rating, Approximation Based on Arizona Utility
Goal of Balanced RE Grid • To Minimize Use of Fossil Fuels and Expensive Storage • Need To Have a Mix of Renewables to Both Provide Energy and Stable Grid: • Mid-day Power --- flat on-site PV • Sunrise to Sunset Power --- concentrating solar • Sunrise to Sunset w Inexpensive Thermal Storage --- concentration solar thermal • Baseload --- geothermal or bio-electric
Renewable Energy COST, cents/kWh (6, 7,9)levelized with current subsidies extended, 2009$
Using Battery Storage • Utility Battery • VRB Flow Battery • Based on 2 MW Unit with 6 Hr at $6.3 M • Round Trip Efficiency = 66% • Doubles the Cost of PV Mix • Raises EC from 10 to 20 cents/kWh • If 50% Residential and Commercial in PV Mix, and • If 50% PV Mix Goes Through Storage • More Than Doubles the Cost of Wind Energy - 7 to 17 cents/kWh • Battery Storage Is Expensive
Environmental Impacts • To Minimize Local and Global CO2 Impacts, U.S. To Reduce CO2 by 80% by 2050 • All RE Options • Avoid Onerous Impacts of CO2 • Desirable As a Class of Options • Among RE Options, There Are a Range of Lesser and Local Impacts
2020 RE Projection • To Minimize Fossil Fuel Use and/or Expensive Storage • To Use Lower Cost Options • To Be Mindful of RE Impacts • To Balance Between In and Out of SD Cty
Projection of SD Region Renewable Energy Sources, 2020 Avg Capacity Factor = 0.37
Results by 2020 • RE Total = 50% of Total Grid Energy • RE avg Capacity Factor = 0.37 • Compared to 0.18 for on-site PV • Compared to 0.54 for Current Grid • SD County Share of Total RE • 37% Power • 28% Energy • RE from Outside SD Cty Less Than Current Import Capacity of Transmission System: • 1925 MW less than 2600 MW (excluding Sunrise) • Should Displace Currently Imported Fossil Energy • No New Transmission Wires Needed
Results, continued • Balancing 10 RE Technologies Could Achieve: • Grid Capacity Factor of About 0.37 to Contribute to Stable Grid and Minimize Use of Expensive Storage • 50% SD Energy by 2020 to Minimize Fossil Use • Balancing of RE Environmental Impacts • Lower Average Cost (in 2020 w/o current subsidies) • RE in Baseline Projection Costs $1200 M/yr • Doubling on-site PV Increases Cost by $60M/y • Tripling on-site PV Increases Cost by $ $115M/y • By Displacing 50% of Grid Energy by 2020, Would Take Major Step in Reaching 80% Reduction of GHG by 2050
Barrier to Long Term Solution to CC • What Made Sense from One Particular Point of View Is Not Supported by Other Views • Solutions Stymied by Lack of Consistent Political Support in the U.S. • Government Policies Flip-Flop from Administration to Administration e.g. NFC to Reagan/Bush to Clinton to Bush to Obama • Need Framework to: • Understand Conflict, and • Devise Strategy to Overcome This Barrier
A Framework for Conflicts Over Energy • Use Cultural Anthropologists • “Cultural Bias Theory” • Made Up of Internally Consistent World Views • Coping Strategies (Not Personality Types) • Enable Efficient Decision Making When Faced with Complex Situations • 4 ENERGY TRIBES: • Egalitarian • Hierarchical • Individualism • Fatalism
HIERARCHICAL • See the world as controllable • Nature is stable until pushed past discoverable limits • Environmental management requires certified experts to determine the precise locations of nature’s limits • Statutory regulation to ensure that all economic activity is kept with those limits • Man is malleable, deeply flawed but redeemable by firm, long-lasting, and trustworthy institutions • Fair distribution is by need, and the need is determined by expert and dispassionate authority
EGALITARIAN (core ecologists) • Nature is fragile and intricately interconnected • Man is seen as essentially caring (until corrupted by coercive institutions such as markets and hierarchies) • We must all tread lightly on the earth --- almost any impact is unacceptable • It is not enough that people start off equal ---- people must end up equal • Trust and leveling go hand in hand, and institutions that distribute unequally are distrusted • Voluntary simplicity (conservation) is the only real solution to our environment problems
INDIVIDUALISM • View nature as benign, resilient, and able to recover from any exploitation • Man is inherently self-seeking and atomistic • Trial and error in self-organizing ego-focused networks (unfettered markets) is the way to go • Those that put in the most in should get the most out • Inequity is good and a natural part of the world of people • Institutions that work with the grain of the market are what society needs
FATALISTIC • Neither rhyme nor reason makes sense in nature • Man is fickle and untrustworthy • Fairness is not to be found in this life • There is no possibility of effecting change for the better • Learning about nature is impossible • A reasonable management response would be, “why bother”
EACH ENERGY TRIBE NOT COMPLETE • Have Strong Capabilities • Have Blind Spots • To Formulate and Implement Effective Approach Would Require a Blending of All