Download
1 / 37
370 likes | 482 Vues
Recent activities on aerosols in TM5 Achim Strunk Twan van Noije, Michiel van Weele. AeroCom-2 contribution by KNMI Preliminary source sink analysis Online dust module EC-Earth/TM5 decadal runs. AeroCom-2: Overview. Aero sol Com parisons between Observations and Models

E N D
Recent activities on aerosols in TM5Achim StrunkTwan van Noije, Michiel van Weele • AeroCom-2 contribution by KNMI • Preliminary source sink analysis • Online dust module • EC-Earth/TM5 decadal runs
AeroCom-2: Overview Aerosol Comparisons between Observations and Models “The AEROCOM-project is an open international initiative of scientists interested in the advancement of the understanding of the global aerosol and its impact on climate.” AeroCom-1: accomplished before IPCC-AR4 AeroCom-2: Ongoing, next stimulus is IPCC-AR5; contribution by many groups/models (CAM*, ECHAM*, FMI-SALSA, GeosChem, GISS*, GLOMAP, GMI, GOCART, HadGEM, LSCE, OsloCTM, SPRINTARS, TM5, …) to various experiments (hindcast, direct/indirect forcing, …) TM5 contribution to AeroCom-1 by Maarten & Frank TM5 contribution to AeroCom-2 by Twan & Achim HCA-IPCC (years 2000-2009), including target year 2006 pre-industrial simulation (1850) TM5 chem V3 with a few new features AR5 (RCP4.5) emissions with natural/biogenic/soil/oceanic from MACCity
AeroCom-2: Diagnostics • 0d (@ stations): • hourly means of full aerosol tracer information (2006) • daily means of full aerosol tracer information (1850, HCA) • 1d (@ stations), vertical profiles: • daily means of of full aerosol tracer information, dry aerosol extinction & absorption PM10 (2006) • 2d: • daily means of optical properties (1850, HCA): • AOD @ {550,440,870}nm, fractions for {SO4,NO3,BC,OA,Dust,SS,H2O} • fine-mode AOD, absorption AOD, asymmetry parameter, dry aerosol extinction / absorption PM10, ambient aerosol extinction • daily means of {emissions, surface concentrations, wet/dry deposition, load, nitrogen budget} (1850, HCA) • daily means of nitrogen budget (1850, 2006) • daily means of SW & VIS radiation fields (1850, 2006) Twan • 3d: • monthly means of extinction, absorption, asymmetry param., etc. • monthly means of full aerosol tracer information, etc. (1850, 2006)
AeroCom-2 Participating in the following studies: • radiative forcing (Gunnar Myhre) • all-aerosol-tracer (Graham Mann) • organic aerosols (Kostas Tsigaridis) • snow & ice radiative forcing (Mark Flanner) • hindcast evaluation (Michael Schultz) • … • no active participation from KNMI foreseen Most striking result by TM5: Very low global mean AODs!
Revision 2 • Bugs discovered: • SO2 emissions high by a factor of 2 (SO4 correct) • SeaSalt emissions low by a factor of 2 (mass) • NH3 emissions 20% low re-run, re-submit to AeroCom database before after
AOD against observations bias: -0.111
AOD fine mode against observations bias: -0.093
Possible reasons • Sources for aerosols too low (emissions) • Sinks for aerosols too high (deposition, sedimentation) lifetime! • Ageing and coagulation too fast in M7 (too few coarse particles) • Hygroscopic growth underestimated • Optics wrong • Combinations of 1. - 5. • …?
Possible reasons • Sources for aerosols too low (emissions) • Sinks for aerosols too high (deposition, sedimentation) lifetime! • Ageing and coagulation too fast in M7 (too few coarse particles) • Hygroscopic growth underestimated • Optics wrong • Combinations of 1. - 5. • …?
Possible reasons • Sources for aerosols too low (emissions) • Sinks for aerosols too high (deposition, sedimentation) lifetime! • Ageing and coagulation too fast in M7 (too few coarse particles) • Hygroscopic growth underestimated • Optics wrong • Combinations of 1. - 5. • …?
Check of the optics code • Originally developed by Michael Kahnert (SMHI) • Lookup-tables for {extinction, single-scattering-albedo, asymmetry-parameter} via • effective refractive index for each log-normal mode in M7 • count mean radius of mode (cmr) • wavelength (wl) • Update by Maarten/Joost replacing (cmr & wl) by (cmr/wl) and production of a new lookup-table
Lookup-Table Revision • Extinction coefficients • as a function of mode-radius • here: for 3 wavelengths and charact. refractive indices of Dust and SO4 • dashed lines: V1; solid lines: V2
Check of the optics code • Originally developed by Michael Kahnert (SMHI) • Lookup-tables for {extinction, single-scattering-albedo, asymmetry-parameter} via • effective refractive index for each log-normal mode in M7 • count mean radius of mode (cmr) • wavelength (wl) • Update by Maarten Krol replacing (cmr & wl) by (cmr/wl) and production of a new lookup-table • effective refractive index retrieved by mixing rules for internally mixed modes, crucial input: • refractive indices and densities of SO4/BC/POM/Dust/SeaSalt/H2O
Check of the optics code • Test(s): • update of densities, esp. carbon compounds, both in M7 and optics • update of optical properties of aerosol components • Results: • increase of max. 10% for global mean AODs (July 2007) • change of AAOD not checked (BC) • Higher sensitivity of AODs to mean particle radii, due to dependence of particle cross section and mass on rg • redistribution of particle mass and numbers!
Possible reasons • Sources for aerosols too low (emissions) • Sinks for aerosols too high (deposition, sedimentation) lifetime! • Ageing and coagulation too fast in M7 (too few coarse particles) • Hygroscopic growth too low • Optics wrong • Combinations of 1. - 5. • …?
Global mean burdens • Comparison with “products” that capture observed AOD frequency distribution: • TM5 (year 2006) • GOCART (year 2006) • HadGEM2 (year 2006) • OsloCTM2 (year 2006) • AeroCom-1 (year 2000) • Importance ranking (partial AOD): • SO4 (20-40%) • SeaSalt (15-40%) • Dust (15-30%) • POM (10-30%) • BC ( 0- 5%) • Main problem: No unique model reference available…
Example: SO4 zonal means load sconc emi wetdep
Example (cont.): SO4 characteristic times • lower sink terms in GOCART / OsloCTM • higher chemical production also possible for GOCART / OsloCTM
Summary SO4: • Surface concentrations good (NH-midlat.), loads on the low side • Rather high sink terms (wetdep), esp. in the tropics SeaSalt: • Despite doubling the emitted mass, the load is still low • Rather high sink terms (wetdep) Dust: • Loads on the low side • Rather high sink term POM: • Loads on the low side (SOA!) • Rather high sink terms (wetdep), esp. in the tropics and the NH BC: • Surface concentrations good, loads on the low side • Rather high sink terms (wetdep), esp. in the tropics
Con(cl/f)usion • Low loads cause low AODs, but presumably the masses can NOT explain the AODs being low by ~50%... • More likely due to wrong size distributions, so are they correct • in M7 (water uptake / coagulation)?? • in the emissions (radii & masses specified)?? • Size distributions interact with removal processes (deposition, sedimentation). • Very low fine mode AOD another hint on wrong particle size distribution. • M7 nucleation/condensation is a very critical process, as seen by the effect of reducing SO2 emissions (H2SO4 precursor).
Outlook • Principle check of removal processes • previous problems known (aan de Brugh, 2010) • first analysis already done for wetdep • adaptation of more sophisticated approaches planned (e.g., ECHAM-HAM; Croft et al., ACP, 2010; ) • especially: • wet removal of number and mass individually • usage of current mode radii instead of predefined ones • take into account cloud type for in-cloud scavenging • … • … • Check of emission routines and underlying assumptions desirable as well
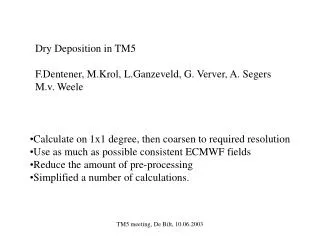
Dust emissions: Introduction • So far: module by Elisabetta Vignati (presented June 2008) • Offline production of daily emissions using ECMWF meteo fields • Algorithm is based on Tegen et al. (JGR, 2002) • definition of possible dust uptake areas: • calculation of the distribution of potential vegetation types (biomes) • non-forest biomes are considered as potential source • usage of normalised difference vegetation index (NDVI) to derive global fraction of absorbed photosynthetically active radation (FPAR) • “shrinking” of available uptake area in case of • grass dominated vegetation (FPAR!) • shrub dominated vegetation (FPAR!) • snow cover • supressing dust uptake when soil moisture exceeds a certain threshold • vertical particle flux from soil properties (size distribution, alpha) and surface wind stress u* (derived from 10m wind speed)
Dust emissions: Offline Implementation • Parameters not dependent on time and grid cell • Properties of soil size distribution based on soil population and texture • Parameters calculated on daily basis • Snow cover from snow depth • Areas of emissions using potential sources, vegetation, cultivation, lsm, fpar (and moisture) • Parameters calculated on 3 hourly basis • Surface stress from wind speed fluxes • Mapping from emission bins (24) to TM5 modes (2: insoluble accumulation and coarse) from presentation by Elisabetta
Dust emissions: Input Parameters • Soil type and size distribution • Preferential dust source areas (paleolakes) • Fraction of absorbed Photosynthetically Active Radiation (FPAR) • Cultivation • Surface roughness length • Vegetation type • Snow depth • Surface wind speed • soil moisture from Ina Tegen ECMWF fields from presentation by Elisabetta
Dust emissions: Vegetation types Using Soil ph from presentation by Elisabetta
Dust emissions: Results for 2000 from presentation by Elisabetta
However, (revised) online version desirable/needed for EC-Earth/TM5
Online dust emissions: What’s new? • Adaptation to TM5-chem-V3 • Input parameter now in one single NetCDF file • Reformulation of the uplift area as a function of FPAR • Lowered hard constraint of LSM == 100 to LSM > 99 • Removed uninitialised parameters, speed optimisation, OpenMP • Identical offline & online version available
Outlook • Implementation of soil moisture • Evaluation of load, AOD etc. compared to usage of Ginoux (median particle size!) • Replacement of input fields by EC-Earth parameters
Decadal runs with EC-Earth/TM5 2000-2009/10 and 2025-2035 • offline and online simulations with TM5 • offline: small pre-processor developed to use EC-Earth CMIP5 output for TM5 • online: CMIP5 restart files for EC-Earth/TM5 • base case: ERA-Interim driven TM5 simulations 2000-2009 • first results for ERA-I (full period) vs. EC-Earth (2000-2002)
EC-Earth/TM5: Decadal runs 2000-2009/10 and 2025-2035, (2060-70) • offline and online simulations with TM5 and EC-Earth/TM5, resp. • offline: small pre-processor developed to use EC-Earth CMIP5 output for TM5 • online: CMIP5 restart files for coupled EC-Earth/TM5 • base case: ERA-Interim driven TM5 simulations 2000-2009 • first results for ERA-I (full period) vs. EC-Earth (2000-2002) Outlook • Evaluation of inter-annual variability, extreme events, etc. by comparison with observations (current climate) • Assessment of climate impact on (aerosol) chemistry by comparing the two (three) time slice experiments