Download
1 / 9
90 likes | 406 Vues
Stem and Leaf Plot. By Max Jones, Mason LeSage, and Kyle Kacala. What is it?. Stem and leaf plots can be used to display quantitative data in an easy way and is also simple to analyze. It is easier because if you were to just write out the numbers it is much more difficult to analyze the data.

E N D
Stem and Leaf Plot By Max Jones, Mason LeSage, and Kyle Kacala
What is it? • Stem and leaf plots can be used to display quantitative data in an easy way and is also simple to analyze. It is easier because if you were to just write out the numbers it is much more difficult to analyze the data. • A stem and leaf plot is much like a histogram, and if you turn it on its side it looks similar to a histogram. • It is used to find the range, median, and mode easily
Why Use It? • You would use this graph if the data that is collected is numerical. • It is used when there are many numerical values and it is difficult to analyze the data if it is just written out. • It can be used with both multiple and single sets of data.
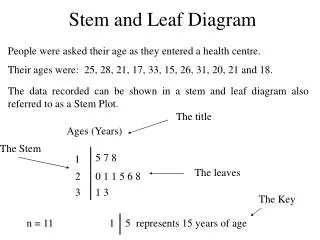
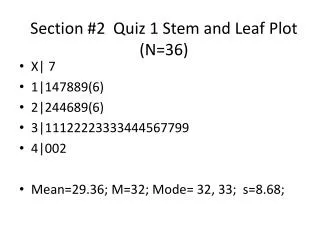
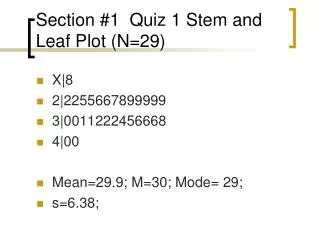
Examples Can you identify the median of the data? Key:6/3=63 This stem and leaf plot represents the number of goals that each team in the Barclays Premier League has scored. This data can help you to predict who is on top of the BPL table.
Continued… Can you identify the Mode of the data? Key: 2/3/1= 32, 31 This stem and leaf plot represents the favorite numbers of students throughout the grade. This data can help people because people who play sports will most likely pick their favorite number as their jersey number so it can help to chose which jerseys are made.
Now You Try! Make a stem and leaf plot using the data below. • 17, 21, 72, 28, 66, 56, 67, 78, 14, 19, 64, 43, 68, 25, 57
Advantages • Can handle large sets of data • Show range, minimum, maximum, median, and mode • Show gaps, clusters, and outliers easily • All of the original data is shown
Disadvantages • Can only use numerical data • Not visually appealing
Sources • http://espnfc.com/tables?league=ENG.1&cc=5901 • http://www.mrnussbaum.com/mathdrills/graphing/stemandleaf.htm • http://en.wikipedia.org/wiki/Stem-and-leaf_display