Download
1 / 25
330 likes | 706 Vues
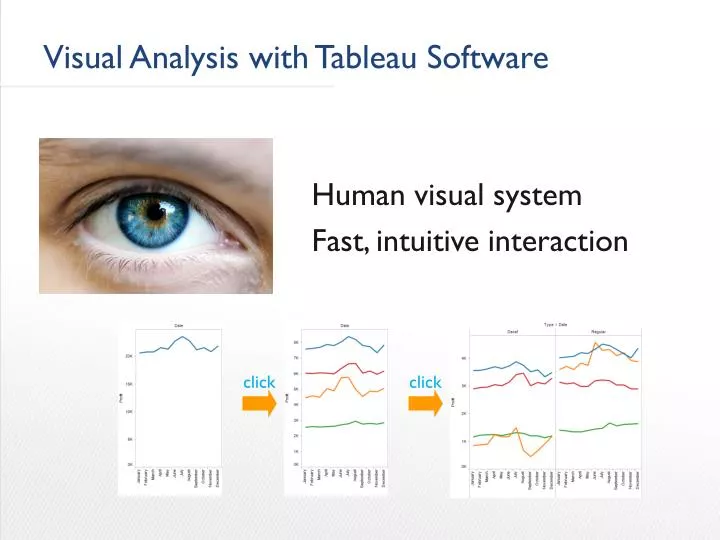
Visual Analysis with Tableau Software. click. click. Human visual system Fast, intuitive interaction. Where Tableau started…. How Do People Work with Tableau?. Personal use on desktop. Web-based visual analysis. Embedded in products. Public use on websites and blogs.

E N D
Visual Analysis with Tableau Software click click Human visual system Fast, intuitive interaction
How Do People Work with Tableau? • Personal use on desktop • Web-based visual analysis • Embedded in products • Public use on websites and blogs
Tableau Commercial Products Tableau Desktop Tableau Server Tableau Public • web-based business intelligence platform • rapid-fire analytics and dashboarding • secure information and metadata management • integration with portals and applications • enterprise collaboration • interactive information graphics for commercial websites • on-the-fly web applications with no programming • tell stories, create conversations • scales to millions of users • Tableau Public Premium • explore, visualize, and analyze data • answer any question • blazing speed against massive data • create dashboards to consolidate views • share interactive data experiences
The Tableau Revolution Fast and easy analytics for everyone Focused as much on the journey as the destination
Speed to Solution US Consulting Report Template_R1.5V_1208.ppt
No scripting or coding – fast, easy and beautiful . . US Consulting Report Template_R1.5V_1208.ppt
Transform all types of data into self-service analytics. Flexible US Consulting Report Template_R1.5V_1208.ppt - 8 -
Self-reliance analytics for everyone US Consulting Report Template_R1.5V_1208.ppt - 9 -
Tableau Architecture: Where’s the data? • Users have a large data warehouse that supports interactive query • Users have a large data warehouse that does not support interactive query • Users have lots of data—and no database or database expertise CorporateWarehouse Data Marts
Tableau Architecture: Where’s the data? Tableau Data Engine Technology Data Warehouse Data Marts Files Cubes • Tableau Native Query Technology • In-memory • Column store • Highly compressed • Optimized API specific for Tableau • 64-bit (32-bit version as well) • Interactive queries to the database • Leverages IT policies for security • Avoids data silos • Ensures fresh data results • Values the EDW strategy SQL Connector MDX Connector Data Engine Use this option: • When the source DB query performance is slow • To offload iterative query workload from the source DB • To work offline from the network • To keep an archive of the data VizQL Compiler User Interface
Teach Yourself Tableau! Follow this plan http://public.tableausoftware.com/views/TrainingResources_0/TrainingResources Watch webinars @ http://www.tableausoftware.com/learn/webinars Join the Tableau community: http://community.tableausoftware.com
Tableau Public First post: April 2009 Public launch: February 2010
Summary Raw data Visual Analysis Data storytelling Easy sharing
Where is the BI blind spot? Numerical power Excel Tableau Discovery power Fast Iteration “Classic” BI Insights you could miss! Platform Capabilities Shared, enterprise data
Tableau: reaching understanding Understanding Struggle Users quit when Expected < Expected benefit reward
Tableau: compelling adoption < 8% • Adoption of business intelligence systems TOO HARD! Why not simply use? SQL scripts Tableau Software “Classic” BI Expected Utility Tipping point (adoption threshold) MS Access Query Wizard Expected Usability
The Tableau Analysis Experience Productivity Threshold Questions Previously unknown questions Insights “Classic” BI Tableau Software The Goal q2 q3 q4 i3 i6 Analytic Power (required) Operational clarity i5 i4 i2 New insights Initial insights i1 q1 Insights (gained) What does the data say?
“Users beyond traditional power analysts adopt intuitive tools more easily and for more functions. Moreover, ease of use reduces the cost of training and change management. “This is evident in the results of the four data discovery tools, which have above average ease-of-use scores, while enabling users of these platforms to conduct the most sophisticated types of analysis. “This paradox — ease of use combined with support for complex analysis — has given them momentum in the market and has caused traditional vendors to attempt to imitate their success with similar offerings. “ Size is cost; orange is above average breadth of function use Gartner: Complexity of Analysis vs. Ease of Use
“Ease of use appears to translate into lower implementation costs, in part because easy-to-use toolsallow IT developers and other BI authors to develop BI content more quickly.” Size is cost; orange is below average integration score Gartner: Ease of Use vs Product Quality Score
More than 9,500 Customers Strong75,000+ Users Worldwide, 95+ Countries A few of the many companies transforming their businesses with Tableau Finance Consumer Media Technology Healthcare Education