Download
1 / 34
380 likes | 733 Vues
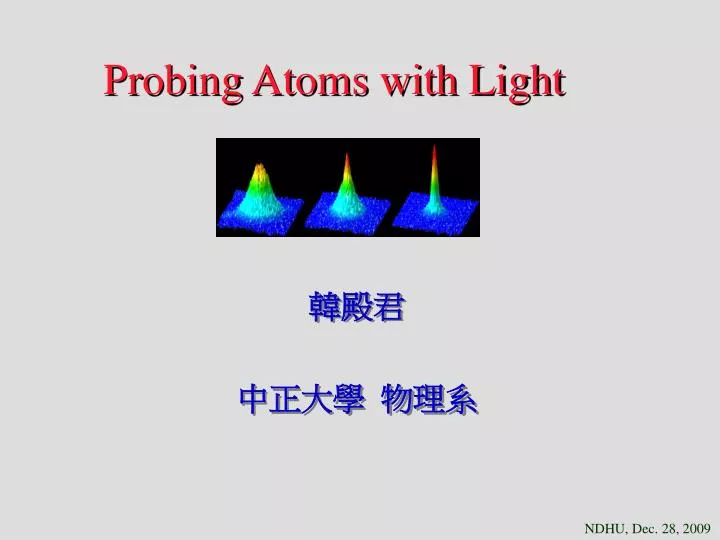
Probing Atoms with Light. 韓殿君 中正大學 物理系. NDHU, Dec. 28, 2009. Outline. In this talk,. I will start by showing you the optical lensing effects in systems from cold to hot gases! Some of the related topics, including the ongoing works and proposed ideas will be discussed subsequently!.

E N D
Probing Atoms with Light 韓殿君 中正大學 物理系 NDHU, Dec. 28, 2009
Outline In this talk, • I will start by showing you the optical lensing effects in systems from cold to hot gases! • Some of the related topics, including the ongoing works and proposed ideas will be discussed subsequently!
I will com back to this later! g Evaporative cooling process! BEC formation! 20 ms 1 ms Introduction: Why need probe atoms? • Temperature Measurement • Monitoring the C.M. motion! • Watching the time evolution of cold clouds!
Studying the dynamics and many more … • Condensate Excitation(m=0 mode) • Cold Collisions axial z radial r ~ 2.5 mm axial size excitation frequency e ~ 43.2 Hz http://www.iop.org/EJ/mmedia/1367-2630/6/1/146/movie2.avi radial size Niels Kjærgaardet al., New J. Phys. 6, 146 (2004). Fluorescence and absorption! All the measurements are based on atom-light interactions! However, they are mostly destructive and harmful to the atoms! 5 ms55 ms
if R > 0, f < 0, n0> 1, < 0 f > 0, n0< 1, > 0 f ,n0= 1, = 0 Light focusing and defocusing by a small ball (linear optics) n0: linear refractive index R: radius : light detuning (to the resonance frequency!) A small uniform ball: “weak” incident light f Effective focal length: Could be tens of microns! n0is independent of light intensity, but depends on ball parameters !
Optical lensing effect (1) A small ball made by cold atoms in high density! n >1013 atoms/cm3!! Absorption imaging: n0 > 1 for red-detuned probe light probe laser f Imaging lens CCD di do z =0 zc
Optical lensing effect (2) false-color absorption images zc = di zc > di zc < di vertical cut profiles
The first part of the following works shown here began by a coincident conversation with my colleague Prof. T.H. Wei . . .
n(I)=n0+n2I Light focusing and defocusing by uniform medium (nonlinear optics) z n(I) I(x, y) “intense” incident light nonlinear coefficient of refractive index Alkaline gas: Clear measurements on detuning and polarization are still not well established! We are interested in the two mechanisms: 1. Saturated atomic absorption: response time 10-8 sec, n2 ~ 10-7 cm2/W, 2. Thermal effects: response time 10-3 sec, n2 ~ 10-6 cm2/W. cold atomCalorimetry!?
Optical lensing effect (3) saturation intensity Gaussian beam: I >> Is CCD Rb MOT (ultracold atoms!) defocusing!
z0 lens sample detector laser laser intensity:I laser detuning: -z 0 +z d Measure the nonlinear lensing effect:Z-scan method iris Stryland et al., IEEE J. of Quantum Electronics 26, 760 (1990) For a saturable Kerr medium (3rd order nonlinearity), the refractive index n(I) and absorption coefficient (I) are and Is : saturation intensity 0: linear absorption coefficient n2 : Kerr index,: spontaneous decay rate Na atoms Sinha et al., Opt. Comm. 203, 427 (2002). Rb atoms Chiao et al., JOSA 20, 2480 (2003). Cs MOT Saffman et al., PRA 70, 013801 (2004).
Positive Lensing positive lensing: sample works as a positive lens! sample position: z, beam waist position: z = 0! lens sample detector size signal z > 0 laser r z 0 lens detector sample size signal laser z < 0 r z 0 A Gaussian beam produces an r-dependent refractive index at each position z!
Z-scan measurement in hot atoms(heatedRb cell) +/– 480 MHz to85Rb F=3 F’=4 transition I ~ 0.2 Is cw measurement measured by photodiode! negative lensing positive lensing open aperture closed aperture significant Doppler broadening! T~ 80 C
Z-scan measurement in cold atoms +/– 30 MHz to 87Rb F=2 F’=3 transition positive lensing negative lensing Measured by CCD at 70 s after MOT turned off! Compared the beam size with and without MOT atoms! I ~ 10 Is , 3 s duration MOT density ~ 1.11010 atoms/cm3 MOT temperature ~ 300 K no Doppler broadening!
Probe atoms by optical diffraction! (depending on refraction!less destructive!)
Far-field diffractionpattern through a cold atom cloud (1) • Single beam detection • Probe beam size larger than cloud size • Allows to measure the cloud parameters, such as • density distribution … CCD probe beam Cs MOT d N ~ 1010 atoms/cm3 = 0.5 Stable intensity is required! Strauch et al., Opt. Commun. 145, 57 (1998)
Far-field diffractionpattern through a cold atom cloud (2) Rb clouds probe beam: size (1/e2 radius): 710 m detuning: -50 MHz red: d= 3 cm, N=5×10⁶ atoms n=1012 atoms/cm3 blue: d= 10 cm, N=5×10⁶ atoms n=1012 atoms/cm3 Simulation green: d= 3 cm, N=4×10⁵ atoms n=1013 atoms/cm3
Optical Diffraction from a 2D lattice Lattice with periodicity in the two transverse dimensions x and y! Far-field diffraction pattern! photorefractive crystal Schwartzet al., Nature 446, 52 (2007)
Dynamics of optical lattice loading? OL beam patterned profile from many mini-lenses while atoms are trapped into each 1D lattice potential? probe beam 1. Switching on OL beams in a MOT 2. Waiting for 3. Probe on and detect 4. Possible to see patterned profiles? 5. Allows to trace the density distribution with ? Rb MOT OL beam
The second part was initially motivated by simply making an interferometer for phase stabilization in order to construct a 2D/3D optical lattice. It seems we can do more and do better and do more . . .
n y n x 2D optical lattice: two dimensional optical standing wave The phase difference locking scheme shown above can be directly applied to the 2D OL by injecting the locking beam into the OL!
2D optical lattice configuration Lattice configuration changes while varies! Top View = 0° = 90° =180°
Previous work on atomic tunneling in 1D optical lattice matter wave interference due to tunneling! OL beam 1D optical lattice + gravity g Rb BEC Tunneling probability per oscillation: P=exp(-2/82g), : energy gap between the ground state band and the continuum states! OL beam Anderson et al., Science 282, 1686 (1998)
Possibly applied to 2D optical lattice? OL beam 1D tube array! 2D optical lattice + gravity Rb BEC “3D view” “top view” OL beam 1. Matter wave Interference while tunneling out? 2. Matter wave interference under different ? Atom Grating?
Simulation ResultsYes! In theory! g g g g = 0° = 90° Waiting for experiment to confirm!
Probe atoms by optical Interference! (nondestructive and more sensitive)
two-beam detection • possibly nondestructive • high S/N ratio Another application:Spatial heterodyne imaging of cold atoms = 1-2 =phase difference between the two beams! Ir position-dependent phase shift: phase image Ip Rb MOT Kadlecek et al., Opt. Lett. 26, 137 (2001) even better than the phase contrast imaging! In general, it requires a little complicated algorithm for phase-shift retrieval! However, direct phase shift imaging is possible if 0, and is stabilized to /2! We can do this as seen in the next page!
Adjustable Phase difference using a Mach-Zehnder Interferometer (1) CCD PZT Controller = 1-2 =phase difference PD2 PZT Mirror Block I2, 2 1st-order Mirror Brewster Plates Laser Brewster Plate Controller I1, 1 0th-order BS BS Window AO Modulator PD1 PD3 VT Driver VR Tunable while with high phase stability!
Adjustable Phase difference using a Mach-Zehnder Interferometer (2) Phase stability of 0.2°(rms) is achieved! -63 63 = -121 121 continuous sweep step-wise sweep
One another application:Phase-shifting Interferometry (PSI) • Fast measurement allowed • High longitudinal accuracy • Offset effects from the detected • signal are cancelled out by • subtraction • Gain effects are eliminated by • taking the ratio sample I2 Mirror BS I1 light source moving for phase adjustment interferogram Phase image (x, y) minimum 3 frames required! optical phase difference (x, y)=
Useful for 2D surface cold atoms imaging?(Michelson type) Li MOT with 108 atoms! Conventional PSI Silicone chip GaAs substrate top view fluorescence! destructive! Iwai et al., Opt. Lett. 29, 2399 (2004) possible for PSI? Less destructive! Trap can leave on! Direct diagnosis of wiring! Folman et al., PRL 84, 4749 (2000)
CCD Phase-shifting Interferometry on cold atoms(Mach-Zehnder type) PD BS Mirror Laser lens to image the position right after the cloud BS Mirror BS atom cloud Similar to the heterodyne method! However, possible to mapping out other phase disturbances other than pure density distribution, such as magnetic field distribution …
Phase-shifting Interferometry on cold atoms(Mach-Zehnder type) Simulation: Rb cloud N ~ 5× 10⁶ atoms false color images density ~1012 atoms/cm3 (a) =0 (b) =45 (c) =90 (d) =135 The probe laser has a radius of 710 m and –50 MHz detuning.
Acknowledgements nonlinear optical refraction and absorptionof atoms 林志杰(Rb cell) 康振方(Rb cell) 吳旭昇(Rb cell) 陳致融(Rb MOT) 黃上瑜(numerical simulation) 黃智遠(Cs cell) 魏台輝(collaborator) phase difference adjustment, stabilization, and imaging 蕭博文 顧子平 atom tunneling 吳欣澤 丁威志