Download
1 / 55
550 likes | 768 Vues
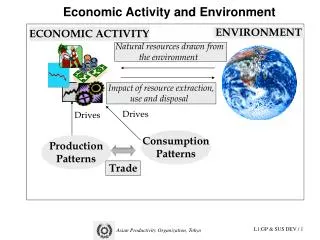
ECONOMIC ENVIRONMENT. Economic Systems. Command. Market. Command Economy. A system where the state owns businesses. The government determines what, where, and how much is produced. And, who receives how much. Market Economy.

E N D
Economic Systems Command Market
Command Economy A system where the state owns businesses. The government determines what, where, and how much is produced. And, who receives how much.
Market Economy A system where the state allows entrepreneurs to own businesses. Entrepreneurs bear the rewards and risks
: Command Economies do allow some businesses to be owned by entrepreneurs. Likewise, Market Economies may own certain businesses and regulate businesses and/or inputs.
Market ReformsCause UnemploymentAnd, hardship; especially for unskilled individuals. Can lead to: poverty, homelessness, crime, and hopelessness.
Ironically, the biggest losers of non-market reforms are the poor. They have to put up with lousy products and higher prices.
Economic Freedom 2002 _______________________________________ Repressed Mostly Mostly Free ____________Unfree__Free ___________ Myanmar Saudi Germany Hong Kong Syria Brazil Czech Singapore Uzbekistan Turkey Japan New Zealand Iran China S. Korea Ireland Cuba India Poland United States Iraq Russia Greece Australia N. Korea Vietnam Mexico Chile Heritage.org/index/2002/#contents
Economic Freedom • Trade Policy • Taxation • Government Ownership • Monetary Policy • Restrictions on Foreign Investment
... • Restrictions on Banking • Wage and Price Controls • Property Rights • Regulations • Black Market
Adam Smith on Government • Defense & Rule of Law • Welfare of the Handicapped, Seniors, and Children. • Public Services
Invest in Human Capital Enhance Skills of People Invest in Health & Environment Invest in Infrastructure Increase the Stock of Physical Capital Do not burden productive sector with government regulations and control Respect Property Rights Open the Economy to Foreign Trade Open the Economy to Foreign Investment Keep Government Small
Economic IndicatorsSize GrowthInflationUnemploymentBalance of Payment
Gross Domestic Product The total value of goods and services produced in a country, regardless of who produces it.
Gross National Product/Income GDP, plus investment income from foreign countries, minus investment income to foreign countries.
GDP/Capita or GNP/Capita • The contribution of each individual toward the total economic activity of a country. • Though, not entirely accurate, the GDP per capita is used as a proxy of that country’s individuals’ relative income level.
2001 GDP/Capita High Income >$ 9,206 Middle Income Low Income <$ 745
GNPs of top 12 countries-2001 • Pop GNP Rank GNP/C Rank • million b $ Dollars • USA 284 9901 1 34870 7 • Japan 127 4574 2 35590 4 • Germany 82 1948 3 23700 20 • U.K. 60 1451 4 24230 16 • France 59 1377 5 22690 24 • China 1272 1130 6 890 138 • Italy 58 1123 7 19470 30 • Canada 31 662 8 21340 26 • Spain 40 587 9 14860 39 • Mexico 99 550 10 5540 68 • Brazil 173 529 11 3060 89 • India 1033 474 12 460 161 World Development Report
GNPs of 10 biggest countries-2001 • Pop GNP Rank GNP/C Rank • million b $ Dollars • China 1272 1131 6 890 138 • India 1033 474 12 460 161 • USA 284 9901 1 34870 7 • Indonesia 214 145 28 680 146 • Brazil 173 529 11 3060 89 • Russia 145 253 18 1750 107 • Pakistan 141 60 44 420 163 • Bangladesh 133 50 49 370 170 • Nigeria 130 37 53 290 178 • Japan 127 4574 2 35990 4 World Development Report
Walmart 220 Exxon 192 General Motors 177 General Electric 126 Citigroup 112 IBM 86 Philip Morris 73 Boeing 58 Sweden 210 Austria 189 Poland 175 Venezuela 125 South Africa 113 Malaysia 88 Philippines 71 Czech 56 GDPs & MNCs in 2001 in b$ World Development Report Fortune.com
Economic Growth GDPt - GDPt-n Growth = ----------------- *100 GDPt-n Where GDPt and GDPt-n are the nominal GDPs for the year (or any period) ‘t’ and ‘t-n’, respectively.
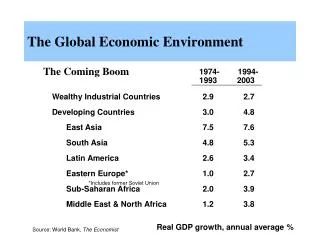
Real GDP Growth/year for 90-00of Selected Countries • China 10.3 • Ireland 7.3 • India 6.0 • USA 3.5 • Japan 1.3 • Russia -4.8 • Ukraine -9.3 World Development Report
Beware GDP/GNP growth rates are usually based on figures in local currency. These do not account for inflation. An apparent high growth in the GDP/GNP may be deceptive if the rate of inflation in that country is high.
For Example: Consider Argentina Year GDP Growth (m Pesos) % 1985 10 1986 22 120 1987 108 391 1988 3103 2773 1989 67974 2091 1990 178704 163
Real GDP The real GDP for year t: rGDPt = GDPt / (1+i) Where, i is the inflation rate between period t and t-n, and GDPt is the “nominal” GDP for the year t.
Inflation CPIt - CPIt-n Inflation = --------------- CPIt-n where CPI = Consumer Price Index for period t and t-n
The inflation adjusted GDP means that it is the value of GDP for year t, measured in the currency value of some previous year (t-n).
Real GDP Growth Rate rGDPt- GDPt-n Growth = ----------------------- *100 GDPt-n Where GDPt-n is the nominal GDP for the year t-n.
Consider Argentina again. Year GDP Nominal Inflation Real (m Pesos) Growth Fraction Growth 1985 10 100 6.00 -71% 1986 22 120 0.86 18% 1987 108 391 1.23 120% 1988 3103 2773 3.48 541% 1989 67974 2091 30.87 -31% 1990 178704 163 23.14 -89%
COUNTRY’S ABILITY TO SUPPORT FOREIGN TRADE/INVESTMENTS Current Earnings Savings Credit Potential
BALANCE OF PAYMENTS STATEMENT A summary of a nation’s financial transactions with the rest of the world.
THREE CATEGORIES 1) Current Account 2) Capital Account 3) Reserves Account
CURRENT ACCOUNT 1- Merchandise Trade 2- Service trade 3- Investment Earnings 4- Private and Official Transfers
CAPITAL ACCOUNT 1) foreign direct investment 2) portfolio investment 3) loans by private foreign banks, government, and multilateral agencies.
RESERVES 1) Cash 2) Gold, etc.
Current Account Debit Merchandise -1030 Services -197 Income -299 Transfers -47 Total -1573 Credit Balance 683 -347 277 80 274 -25 0-47 1234-339 Balance of Payment U.S.: 1999: $b US Census Bureau, Statistical Abstracts of the US:2000
Balance of Payment of the U.S.: 1999 Credit Balance 283 131 326 228 97- 34 706325 -339 - 14 • Capital Account Debit • FDI -152 • Portfolio - 98 • Other -131 Total -381 Current Balance Overall Balance
Balance of Payment of the U.S.: 1999 Debit • Overall Balance -1954 • Reserve Account • Foreign Assets 0 • Change in Res. 0 Discrepancy -39 Total 1993 Credit Balance 1940 -14 45 45 8 8 -39 1993 0
Merchandise Trade Balance • ban or restrict the import of foreign goods • encourage setting up of import- substitution industries • encourage setting up of export based industries
Service Trade Balance • prohibit or restrict the import of foreign services • encourage setting up of import substitution industries • promote setting up of export based industries (tourism)
Investment Earnings Balance • severe restrictions on the use of foreign exchange • place restrictions repatriation of incomes • encourage reinvestment/generation of foreign exchange
Transfers Balance • restrictions on financial aid.
Capital Account Balance • Restrictions on outgoing foreign investments. • Incentives to attract foreign direct investment.
Reserves Falling reserve base triggers: devaluation of currency This, however, lead to: High inflation Capital flight
ECONOMIC INTEGRATION 1- Free Trade Agreement 2- Customs Union 3- Common Market 4- Monetary Integration 5- Full Economic Integration