Download
1 / 22
220 likes | 323 Vues
CPSY 501: Class 4 Outline. Please download the “04-Record2.sav” dataset. Pro-D talk on REB: Thu 30Sep ~1:50 RNT125 Correlation and Partial Correlation OLS Linear Regression Using Regression in Data Analysis Regression Requirements: Variables Regression Requirements: Sample Size

E N D
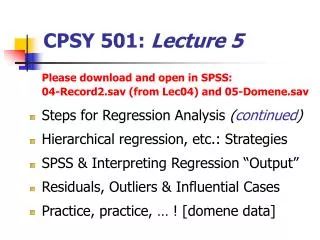
CPSY 501: Class 4 Outline Please download the “04-Record2.sav” dataset.Pro-D talk on REB: Thu 30Sep ~1:50 RNT125 • Correlation and Partial Correlation • OLS Linear Regression • Using Regression in Data Analysis • Regression Requirements: Variables • Regression Requirements: Sample Size • Assignments & Projects
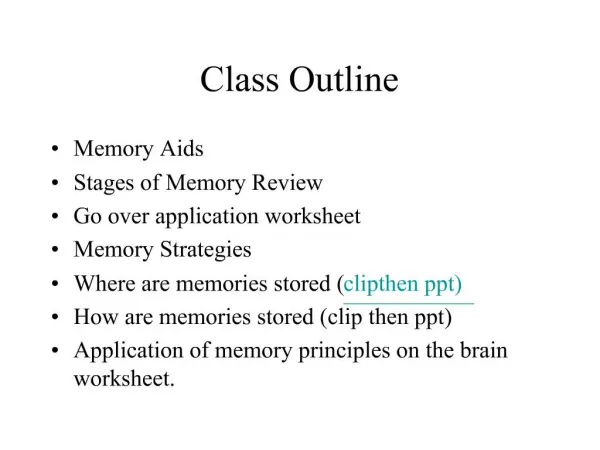
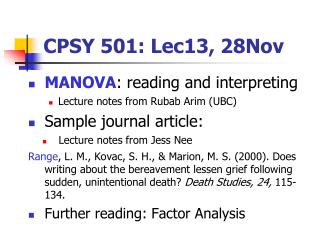
Inferences from correlation • In some situations, it is possible to make some inferences about causality using correlational methods. • To do so usually involves: • Three or more variables in the correlation • Re-framing “causality” as an issue of direction of influence, rather than finding the one thing that is ultimately responsible for changes in another variable
Inferences from correlation (cont.) These inferences are based primarily on theory and/or prior empirical evidence. Additionally, it is necessary to rule out other competing explanations for the relationship The temporal sequencing of the variables can strengthen claims about direction of influence When correlational methods are used in the context of identifying direction of influence, we often use the term “regression.”
Psychological Well-being Language Ability Language Ability 1 year Direction of Influence … Level of Acculturation Psychological Well-being Time 1 Time 2
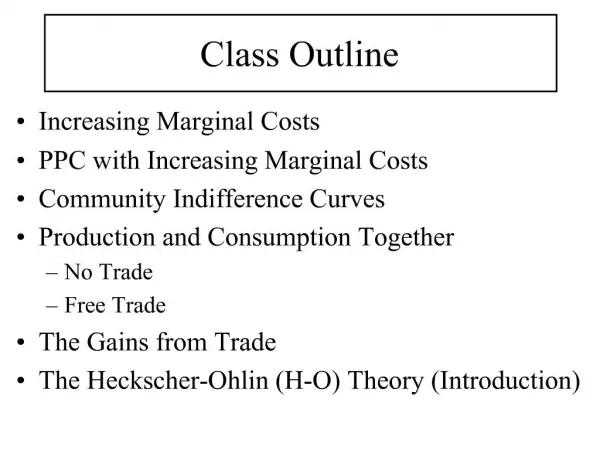
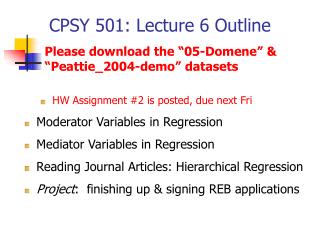
Partial Correlation Purpose: to measure the unique relationship between two variables (after the effects of other variables are “controlled for”). The SPSS calculation of partial correlations assumes parametric data (although regression strategies works for nominal variables & sometimes other non-parametric variables as well) analyse>correlate>partial OR analyse>regression>linear>statistics>”part and partial correlations”
Partial Correlation (cont.) Variable 2 Variable 1 Mediating Variable
Other mediator Partial Correlation (cont.) Partial Correlation
Partial Correlation Purpose: to measure the unique relationship between two variables (after the effects of other variables are controlled for). The SPSS calculation of partial correlations assumes parametric data to (although, theoretically, should be possible to partial out the effects of non-parametric variables as well) analyse>correlate>partial OR analyse>regression>linear>statistics>”part and partial correlations”
OLS Regression Ordinary Least Squares (OLS) Linear Regression Combining the influence of a number of variables (predictors, “IVs”) to determine their total effect on another variable (outcome, “DVs”).
Regression Simple Regression: 1 predictor Simple regression: predicting scores on an outcome variable from a single predictor variable (mathematically similar to bivariate correlation)
Simple Regression (cont.) • In OLS regression, the “best” model is defined as the line which results in the lowest sum of squared differences between model and data. • Conceptual description of regression line: Y = b0 + b1X1i+ (B2X2i … + BnXni)+ εi Outcome Intercept Gradient Predictor Error
Fitting a Regression Model R2 in regression = the proportion of the variance in outcome accounted for by predictors It is also possible to determine how adequate the R2 model is, as a reflection of the actual obtained data (goodness of fit) through significance testing F ratio in regression: variance attributable to the model divided by the amount of variance attributable to error. The p-value associated with the F-ratio shows whether the “fit” is good. = analyze> regression> linear
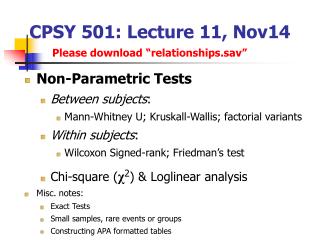
Example: Record Sales • Outcome variable: Record sales • Predictor: Advertising Budget • R2 = .335, R2adj = .331;F (1, 198) = 99.587, p < .001 • Ŷ = .578 x ABz + 134
Multiple Regression 2 or more predictor variables in the model How can we use multiple regression? • Regression techniques can implement all versions of the General Linear Model • ANOVA and ANCOVA • curvilinear models • mediation & path analysis; etc.
Regression Modelling Process Sequence for building & testing an OLS regression model: Develop research question (RQ), select appropriate ways to measure predictor & outcome variables, & determine required sample size (G*Power) After data collection and entry, identify and deal with data entry errors, outliers and missing data problems, fixing as necessary Explore variables to check for requirements of OLS regression, fixing as necessary
Regression Process (cont.) Model Building: RQ specifies entry method, so run a series of regressions to “see” what effects fit with your model specifications Model Testing: assess for “diagnostic” issues. If there are multivariate outliers or overly influential cases, fix them and return to Model Building stage. Model Testing: assess for “generalizability” issues. If there are violations of regression assumptions, fix them and return to Model Building stage. Run final, tested model and interpret the results
Selecting Variables in Regression According to your model or theory, what variables relate to your outcomes? Is there anything in available research literature to suggest important variables? Do the variables meet all the requirements for an OLS multiple regression? (see subsequent slides) Record sales example: what is a possible outcome & why? what are possible predictors & why?
Derived Variables in Regression: Examples • Transformed variables: for assumptions • Interaction terms: “moderating” variables • Dummy variables: coding for categorical predictors • Curvilinear variables: for non-linear regression
Sample Size Requirements Required sample size depends on anticipated size of effect, and total number of predictors. Sample size calculation: • Use G*Power to determine exact sample size. • Roughestimates available on pp. 172-174 of Field. Consequences of insufficient sample size: • Regression model may be overly influenced by individual participants (i.e., model may not generalize well to others) • Insufficient power to detect “real” effects of moderate size. Solutions: • Collect more data from more participants; • Reduce the number of predictor variables in the model
Requirements of Regression Variables The Outcome (Dependent) Variable should: Be interval/continuous (examine the variable). Consequences if violated: mathematics will not work Solutions: If categorical, use Logistic Regression. If ordinal, use Ordinal Regression, or possibly convert into categorical form. 2) Have a normal distribution (normality tests, etc.). Consequences if violated: significance testing in the model will not work properly. Solutions: Check for outliers, etc., OR data transformations OR use caution in interpreting the significance parts of the results.
Requirements of Regression Variables The Outcome (Dependent) Variable should: 3) Have anunbounded distribution (obtained range of responses versus possible range of responses). Consequences if violated: artificially deflated R2 Solutions: Collect data from people from the missing portion, OR use a more sensitive instrument 4) Have independence of scores (examine the research design). Consequences if violated : invalid conclusions Solutions: redesign your data set to ensure independence; use multi-level modelling instead of OLS regression.