Download
1 / 28
290 likes | 392 Vues
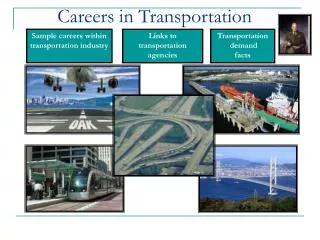
Careers in Transportation Planning. What is the role of the transportation planner? An overview of transportation opportunities for all planners Employment outlook for urban and regional planners. What is the Role of a Transportation Planner?.

E N D
Careers in Transportation Planning What is the role of the transportation planner? An overview of transportation opportunities for all planners Employment outlook for urban and regional planners
What is the Role of a Transportation Planner? • Transportation planners work to improve the quality of life of the communities they serve by developing sustainable solutions to issues such as urban sprawl, traffic congestion, air pollution, access to jobs, and the mobility needs of an aging population
Long Range Transportation Models Local Future Land Use Plans Employment & Household Projections • Assumes future land use is valid • Assumes community will develop per its plan Projected Deficiencies (congestion) and Alternatives Analysis Recommended Changes – typically to add capacity Source: Washtenaw Area Transportation Study (WATS), LSL Planning, Inc.
Comparison of the Planning Processes • Major Difference: • Transportation based on planned Land Use • Land Use has limited consideration of transportation
A New Paradigm • Link land use with transportation: • Land use arrangement to reduce peak hour auto trips • Site design to support bicycling/walking/transit • Combine land-use planning with transportation planning (regional, community, and site specific) • Increased cooperation among all parties involved in land use and transportation • Operate in limited funding environment by planning practical (and affordable) and sustainable solutions to meet our transportation system needs Photo: LSL Planning, Inc.
Role of the Transportation Planner • “Bridge the gap” • Educate parties in an understandable way • Focus on long term • Advocate for underserved groups • Environmental justice • Use transportation to improve community sustainability Source: LSL Planning, Inc.
Public Involvement • Facilitate, educate to gather meaningful input • Brochures • Open house • Public workshops • Advisory committees • “Road show” • Visualization/simulation Photos: Courtesy of LSL Planning, Inc.
A transportation planner does . . . • Long range plans • Corridor simulation models • Flexible design/street widths/road diets (traffic calming/CSS) • Non-motorized plans & walkable design • Demand management • Transit oriented land use and design • Access management • Overlay zones • Form-based codes • Transportation to support economic development
Corridor Planning • Identify the function and character of major streets • Traffic operations (Level of Service) • Accommodate all users • Access system • Road and streetscape design (Context Sensitive Solutions) Bluffton, SC Portage, MI Source: LSL Planning, Inc.
Access Management Cost effective traffic management methods to: • Promote the flow of traffic • Improve safety of pedestrians & vehicles • Improve aesthetics of roadway areas …by managing the location, quantity, type & design of access to a roadway Sources: Photo and Cover, MDOT Access Management Guidebook. Graphic, LSL Planning, Inc.
Benefit: Safety • Access management can help reduce injuries and property damage due to crashes • Doubling of accessdensity from 10-20 access points per mile often results in about a 40% increase in expected crash rates* *according to the Michigan Department of Transportation Source: FHWA, MDOT Access Management Guidebook
Context Sensitive Solutions (CSS) Designing for: • Character • Users • Land Uses • Multiple Functions • Linking to the past and to the future CSS Median Cross-Section Alternative Roadway Cross-Sections Source: LSL Planning, Inc.
San Jose, California Existing conditions
San Jose, California Mixed-use development at sidewalk
San Jose, California Street trees; medians and pedestrian refuges; crosswalks
San Jose, California Live-work housing; mixed-use building
San Jose, California Bus lane
San Jose, California Rapid transit lane demarcated in red
Promote Effective Solutions Transportation planners can promote effective solutions such as roundabouts, ITS, creative interchange design, multi-modal streets and traffic calming measures. This includes both technical analysis and building support from other professionals, the public, and decision makers. Photo: LSL Planning, Inc. A multimedia demonstration from the City of Sammamish, WA official website.
Road Diets • Reducing # of traffic lanes to provide left turn, transit, or bike lane • Consider: • Function & environment • Traffic volumes (consider for 8,500 – 24,000 vpd) • Peak hour volumes & Level of Service • Crash types, pedestrian, bike, & transit activity • Impact on parallel roads Before After Washtenaw County Access Management Plan: One-Way 3-to-2 Road Diet Concept Source: LSL Planning, Inc.
Transit Oriented Development (TOD) • Moderate to higher density • Within an easy walk • A mix of uses • Designed for the pedestrian • New construction or redevelopment • Increases transit ridership • Strong benefits
Using Transportation as a Catalyst • Rather than respond to land use, trans-portation investment can be a catalyst to sound, sustainable growth and develop-ment • Increase property value by improving access and safety • Balance land use with traveler needs • Examples: • Convert one-way to two-way • Add on-street parking • Add transit (Bus rapid transit/ streetcar/light rail) Images Source: City of Birmingham, MI Triangle District Master Plan, LSL Planning, Inc.
Manage Demand • Transportation planners also help manage transportation demand by taking any action or set of actions intended to influence the intensity, timing and spatial distribution of demand for the purpose of reducing the impact of traffic or enhancing mobility options by • Offering commuters one or more alternative transportation modes and/or services • Providing incentives to travel on these modes or at non-congested hours, or • Providing opportunities to better link or "chain" trips together, and/or incorporating growth management or traffic impact policies into local development decisions. Photo with permission from VPSI
Outlook for Transportation Planners Employment Outlook Job Outlook Earnings
Employment Outlook • Urban and regional planners held about 38,400 jobs in 2008. • About 66 percent were employed by local governments. • Companies: • architectural, engineering, and related services, • management, scientific, and technical consulting services Source: Bureau of Labor Statistics’ Occupational Outlook Handbook, 2010-11 Edition http://www.bls.gov/oco/ocos057.htm#outlook
Job Outlook • Faster than average employment growth • Employment of urban and regional planners is expected to grow 19 percent from 2008 to 2018 • Most new jobs will be in affluent, rapidly expanding communities. • Job prospects will be best for those with a master's degree • Bachelor's degree holders with additional skills in GIS or mapping may find entry level positions, but advancement opportunities are limited. Source: Bureau of Labor Statistics’ Occupational Outlook Handbook, 2010-11 Edition http://www.bls.gov/oco/ocos057.htm#outlook
Earnings • Median annual wages of urban and regional planners were $59,810 in May 2008. • The middle 50 percent earned between $47,050 and $75,630. • The lowest 10 percent earned less than $37,960, and the highest 10 percent earned more than $91,520. Source: Bureau of Labor Statistics’ Occupational Outlook Handbook, 2010-11 Edition http://www.bls.gov/oco/ocos057.htm#outlook
Acknowledgements ITE Transportation Planning Council thanks the following individuals for contributing material for this PowerPoint presentation • Brad Strader, AICP, PTP, LSL Planning, Inc. • Lucy Gibson, Smart Mobility • UrbanAdvantage