Download
1 / 33
330 likes | 413 Vues
PLANS FOR THE GOES-R SERIES AND COMPARING THE ADVANCED BASELINE IMAGER (ABI) TO METEOSAT-8. James J Gurka, Gerald J Dittberner NOAA/NESDIS/OSD Timothy J. Schmit, NOAA/NESDIS/ORA Mathew M. Gunshor, Kris Karnauskas Cooperative Institute for Meteorological Satellite Studies (CIMSS)

E N D
PLANS FOR THE GOES-R SERIES AND COMPARING THE ADVANCED BASELINE IMAGER (ABI) TO METEOSAT-8 James J Gurka, Gerald J Dittberner NOAA/NESDIS/OSD Timothy J. Schmit, NOAA/NESDIS/ORA Mathew M. Gunshor, Kris Karnauskas Cooperative Institute for Meteorological Satellite Studies (CIMSS) Madison, WI June, 2004 Prague UW-Madison
GOES Users’ Conference I&II Recommendations: Instruments • Strong Endorsements for Improved: • Spatial resolution • Spatial coverage • Temporal resolution • Spectral resolution • Radiometric accuracy
NOTIONAL BASELINE DISTRIBUTED SATELLITE ARCHITECTURE WEST EAST • Advanced Baseline Imager (ABI) • Hyperspectral Environmental Suite (HES) • Solar Imaging Suite (SIS) • Space Environmental In-Situ Suite • GOES Lightning Mapper (GLM) A-Sat ABI SIS GLM service A-Sat ABI SIS GLM services B-Sat HES SEISS services B-Sat HES SEISS services
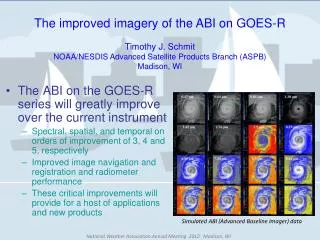
ABI Current Spectral Coverage 16 bands 5 bands Spatial resolution 0.64 mm Visible 0.5 km Approx. 1 km Other Visible/nearIR 1.0 km n/a Bands (>2 mm) 2 km Approx. 4 km Spatial coverage Full disk 4 per hour Every 3 hours CONUS 12 per hour ~4 per hour Visible On-orbit calibrationYes No Low-light imaging Yes No The Advanced Baseline Imager:
ABI spatial coverage rate versus the current GOES Imager ABI coverage in ~5 minutes Current GOES coverage in 5 minutes • There are two anticipated scan modes for the ABI: • full disk images every 15 minutes + CONUS images every 5 minutes + mesoscale. • Full disk every 5 minutes.
ABI Bands Based on experience from: MSG/AVHRR/Sounder(s) MODIS, Aircraft, etc Current GOES Imagers
HES Sounder Capabilities • Coverage: near full disk/ 1 hr • 10 km footprint • Useful information 65 deg. from Sat. Sub. Point • 4 km footprint in Meso/Severe Wx mode • Rapid Scan option • 1000 x 1000 km in 4 minutes • Will detect temperature inversions • Will provide information in cloudy areas • Cloud top characteristics • Temperature and moisture information above cloud tops
HES’ HES
UW/NOAA Targeted observations -- look where we need the information
Sounder Comparison (GOES-Current to HES-Req) CurrentRequirement Coverage Rate CONUS/hr Sounding Disk/hr Horizontal Resolution - Sampling Distance 10 km 10 km - Individual Sounding 30-50 km 10 km Vertical resolution ~3 km 1 km Accuracy Temperature 2 deg. K 1 deg. K Relative Humidity 20% 10%
100 100 Advanced Sounder GOES (18) Pressure (hPa) Pressure (hPa) 1000 1000 Moisture Weighting Functions High spectral resolution advanced sounder will have more and sharper weighting functions compared to current GOES sounder. Retrievals will have better vertical resolution. UW/CIMSS
New NOAA Instrument Severe Storm Warning Times Lightning Danger Alerts Disaster Team Response Nitrogen Production Detects Total Strikes:In Cloud, Cloud To Cloud, And Cloud To Ground Compliments Today’s Land Based Systems That Only Measures Cloud To Ground (About 15% Of The Total Lightning) Increased Coverage Over Oceans And Lands Currently No Ocean Coverage, And Limited Land Coverage In Dead Zones Parameters Hemispheric Or CONUS Coverage 10 Km Spatial Resolution (1 Km Goal) GOES LIGHTNING MAPPER
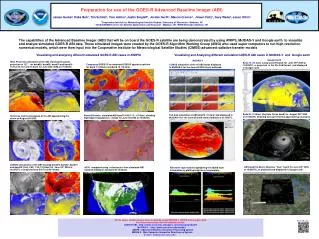
EUMETSAT and all are to be congratulated on the successful MET-8 program to a more robust geostationary imager. Due to Met-8’s improved spectral, temporal and spatial data, Met-8 can be used to help prepare for the next generation U.S. geostationary imager. If Met-8 is to be to for risk reduction activities for the Advanced Baseline Imager (ABI), then the similarities and differences of the data must be characterized. Do to the varying center and spectral widths, some ABI/MET-8 bands are very similar, while others less so.
Visible and near-IR channels on the ABI The ABI visible and near-IR bands have many uses.
AVIRIS spectra Snow, Phase Cirrus Part. size Veg. Haze Clouds Visible and near-IR channels on the ABI The current GOES has only one visible band.
While there are differences, there are also many similarities for the spectral bands on MET-8 and the Advanced Baseline Imager (ABI). Both the MET-8 and ABI have many more bands than the current operational imagers.
Weighting Functions for the IR channels on the ABI Weighting functions for the standard atmosphere at a local zenith angle of 40 degrees.
Forward model calculations for the U.S. standard atmosphere (clear-sky) at nadir view comparing the ABI and MET-8 These brightness temperature differences are not errors, just differences due to varying spectral widths and centers that should be understood.
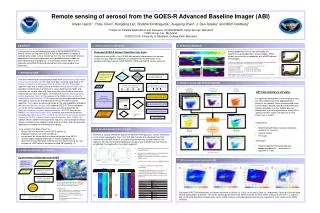
ABI v. MSG – Visible, near-IR Comparing the impact of spectral response differences for the 0.8 m, and 1.61 m bands from the Advanced Baseline Imager and the Meteostat Second Generation (MET-8) satellites is accomplished for the visilble bands by convolving the various spectral response functions with high spectral resolution AVIRIS (aircraft) data. Below is a spectral plot of a clear and cloudy scene over the SCAR-B scene.
ABI v. MSG – Visible, near-IR The 0.6 and 1.6 m bands are very similar, while the 0.8 m band is more different between the two instruments due to the differing center wavelength.
MSG v. current GOES Imager – 4 m AIRS data cannot be used to simulate the MSG 4 m band due to the wide spectral region coved by the MSG extends beyond the data for AIRS. So, a calculated spectra was used. GOES-12 and MSG 3.9 m SRF and night-time spectra. GOES-12 BT: 288.3K MSG BT: 284.5K GOES-MSG: 3.8K
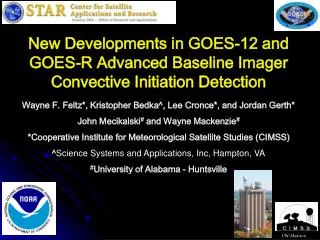
ABI v. MSG – Some IR bands Comparing the impact of spectral response differences for (some of) the IR from the Advanced Baseline Imager and the Meteostat Second Generation (MET-8) satellites can be accomplished by convolving the various spectral response functions with high spectral resolution AIRS (NASA satellite) data. Below is a sample of a SRF at one AIRS spectra in the IR window region.
Some bands can not be processed due to spectral gaps in the AIRS coverage. Of course the AIRS is coarser spatial resolution compared to the MET-8 or what ABI will be. Below is a sample simulated from AIRS for the MET-8 IR window region. This case is from March 19, 2004 at approximately 1:30 UTC. 11 um image
7.3 m difference Some of these differences may be due to spectral gaps in the AIRS data.
9.6 m difference Some of the difference between the convolved AIRS and forward calculations may be due to the amount of ozone
11 m difference Fairly small differences
12 m difference Fairly small differences—largest in warmer (clear) regions
13 m difference Fairly large differences due to the varying spectral widths
Summary • Met-8 is leading the way with an advanced multi-spectral geostationary operational imager. Met-8 data will be used to prepare for the ABI. • ABI and Met-8 have a number of similar bands, although due to spectral response differences, care must be taken when comparing the various bands. • Some ABI/MET-8 bands are expected to be more similar (0.6, 7.35 and 8.7 m) • While other ABI/MET-8 bands are expected to be somewhat different (0.8, 3.9 and 13.3 m) • We look forward to the continuous nature of the high-spectral IASI instrument so more of the ABI bands can be simulated due to the removal of various spectral gaps.