Download
1 / 14
140 likes | 268 Vues
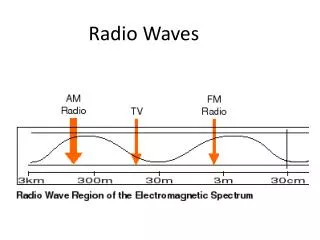
Physics of the Geospace Response to Powerful HF Radio Waves. HAARP-Resonance Workshop, 8-9 November 2011. Evgeny Mishin Space Vehicles Directorate Air Force Research Laboratory. Acknowledgments: Chin Lin, Todd Pedersen of AFRL and Gennady Milikh of UMD . OUTLINE. Introduction

E N D
Physics of the Geospace Response to Powerful HF Radio Waves HAARP-Resonance Workshop, 8-9 November 2011 Evgeny Mishin Space Vehicles Directorate Air Force Research Laboratory Acknowledgments: Chin Lin, Todd Pedersen of AFRL and Gennady Milikh of UMD
OUTLINE • Introduction • HF-driven plasma instabilities • Descending artificial plasma layers: Electron acceleration • Ionizing wave • Density ducts and ion outflows: Deficiency of heating
Natural Aurora Ring-like Structure Moon Magnetic Zenith Spot Remote Imager Ionosonde Cartoon of Artificial Aurora B F region 630.0 SEE AA 557.7 nm On-site Imager HF Transmitter
HF Heating Energy Conversion Electromagnetic Waves Electrostatic Waves Energetic Electrons
Descending ArtificialPlasma`Layer’ • (left) Ionosonde background echoes (the heater off). • (center) Heater on: Two lower layers of echoes near 160 and 200 km virtual height for 210 s. • (right) True height profiles. • 1-sec Images of AA from: (top) the remote site at 557.7-nm and the HAARP site looking up along B at 557.7-nm (2nd row)and427.8 nm (3rd row). • 4th row: Average intensities at 427.8 nm for the images’ center A tomographic reconstruction of the cross-section of the 557.7-nm volume emission rate for 210 s Pedersen et al., GRL 2010
Optical Ring Pedersen et al., GRL 2010
Descending Ionizing Wavefront • Three potential mechanisms : • 1) suppression of recombination by electron temperature increases • 2) thermal redistribution of plasma by the electron pressure bulge • 3) ionization by suprathermalelectrons. • The observed strong optical emissions at 557.7, 777.4, and 427.8 nm are most consistent with (3) Time-vs-altitude plot of 557.7 nm optical emissions along B with contours showing the altitudes where fp =2.85 MHz (blue),UHR= 2.85 MHz (violet), and 2fce = 2.85 MHz (dashed white). Horizontal blips are stars. Ion Acoustic Line backscatter is shown in green. Red dashed lines indicate Ionizing Wavefronts during heater-on periods (NB: Repeatable self-quenching). Mishin & Pedersen , GRL 2011
Accelerated Electrons & Ionization • Near 180 km the plasma frequency in the descending layer reaches f0or ne=nc blocking propagation of the HF beam above the artificial layer. The artificial plasma is now completely self-sustained and rapidly propagates along the magnetic field downward as the ionizing wave front due to ionization by accelerated electrons. (a) Altitude profi les(0,h) at 0 =10, 15, ...100 eV and h0 =150, ...200 km. (b) Half-widths g (thin lines) and b (thick) of the green- and blue-line excitation layers near hc =160 (circles) and 180 (solid lines) km. Mishin & Pedersen, GRL 2011
Ionizing Wave At each time step artificial ionization occurs near the altitude hc, where ne=nc. The density profile just below hc is represented as Distance along B Ionization by accelerated (subscript a) electrons increases the plasma density near hc Average ionization length Ionization time In excellent agreement with the optical observations Speed of descent
Ducts and Ion Outflows Density ducts O+/ne ratio Observed during the period of descending APLs Milikh et al., GRL, 2010 Ion vertical velocity
Simulations SAMI2 FLIP 4 min heating at 4000 K/ s Before heating (t = 0) ions drift downward at < 20 m/s. During heating (t= 3 min) ions drift upward at altitudes from 300 km to 1000 km and reach 160 m/s at 600 km. After heating (t = 6 min) ions drift downward below 800 km and upward at higher altitudes After cooling (t = 9 min) ions move downward • 2-min steps. • Two experimental values on the left are from ionosonde skymaps and that on the right is from DMSP F15. • Match after 6 min in the strongest heating. 11 Milikh et al., GRL, 2010
Simulation vs. observations • Contradicts to the conventional fluid models • Requires that heat transfer or/and suprathermal effects be accounted for. Observed in only 3 min in the heating 3 km/s upward propagation speed 12
Summary • The HF-driven ionization process is initiated near 220 km altitude in the ambient F layer. Once the artificial plasma reaches sufficient density to support interaction with the transmitter beam it rapidly descends as an ionization wave to ~150 km altitude. Ionizing wave model due to HF-accelerated electrons explains the observations. • 2-3 km/s speeds needed to explain the fast appearance of artificial ducts and ion outflows in the topside ionosphere contradict to the conventional (fluid) models. • Point to suprathermal populations and/or heat transfer processes.
EISCAT UHF radar observations MZ Te Ne Vi