Download
1 / 50
510 likes | 605 Vues
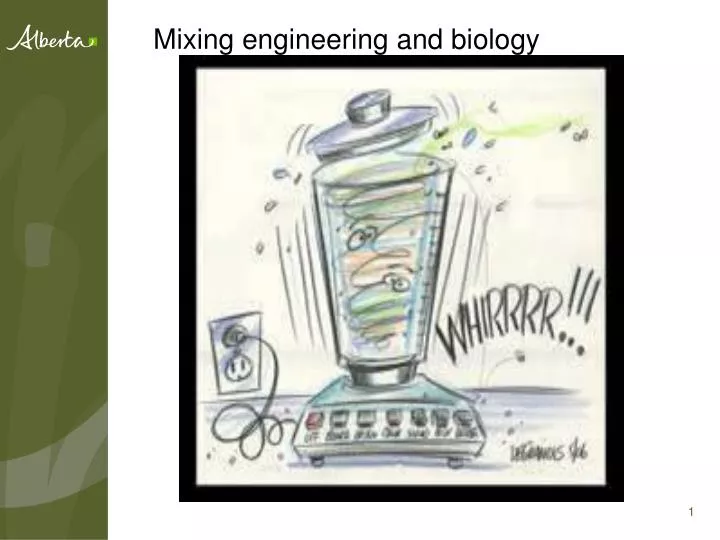
Mixing engineering and biology. Where Fish Passage is required.

E N D
Where Fish Passage is required Connectivity is required across the landscape wherever there are fish. Fish and fish habitat assessments standards are under development for TRANS. These are will indicate species specific and crossing specific information so sensitive sites (such as spawning sites) can be avoided when planning the location of watercourse crossing sites.
In terms of culverts, dependent on one’s viewpoint, a culvert providing fish passage is envisioned as either this:
Fish Passage Criteria Culvert Diameter Culvert Slope Roughness Velocity In certain cases, type of fish species and invertebrate species
In the past, TRANS had approached regulatory agencies in comparing velocities and depths in a stream to what was in the culvert. For example, we used to produce this type of table: Note: This has now been updated.
Unfortunately, we didn’t realize that the relationship between hydrotechnical design parameters was not clear to folks that weren’t used to dealing with it. For example, how did flow relate to velocity?
In order to create this basic understanding with everyone we’ve used a real life example to illustrate the process. In this we are using the new (draft) Fish Passage Design Discharge (FPDD).
The project involves 12 watercourse crossings – 3 of which are fish bearing. The fish species that is present is Athabasca Rainbow Trout.
We’ve approached the issue of fish passage by using a series of informational tools. It proves due diligence and we now have a record of the site.Here are some of the tools.
We produced individual site analyses using satellite imagery.
Slope • Crossing 2
Site 2 – Slope Summary Channel Slope At Crossing S~ 1.2% Upstream of Crossing S~ 2.9 to 6.2% Downstream of Crossing S~ 1.8% (entering receiving channel)
Slope • Crossing 3
Site 3 – Slope Summary Channel Slope At Crossing S~ 1.1% Upstream of Crossing S~ 3.2 to 8.0% Downstream of Crossing S~ 0.8% (entering receiving channel)
Defintions Q - Discharge = the rate of flow of water. It is the volume of water passing through a cross section of a channel in a given period of time. This is not a constant value; it is constantly changing. It is expressed as cubic meters per second (CMS)
A - Area = Cross sectional area of flow in the channel. • V - Velocity = the mean velocity for the cross section, as determined by V=Q/A. Whatever you do remember that V = Q/A
Definitions: Y - depth of flow B – channel bed width h – hydraulic bank height T – top width S – channel slope n – roughness parameter
DA = Gross Drainage Area (km2) In this case 22 km². Q Design= flow (cubic meters per second)
Y@ QD= depth at design flow Y @ QD = average channel flow depth at design flow (discharge) But the numbers you really have to watch for are: QFPDD= flow at fish passage design discharge Y @ QFPDD = depth at fish passage design discharge Velocity FPDD = velocity at fish passage design discharge
Remember, fish are energetically efficient. These are average velocities meaning there are lower and higher velocity zones in the culvert. The trout will exploit these.
Although implicit in this presentation TRANS embeds culverts to D/4 up to 1 meter
Techniques we are using to enable fish passage in steeper creeks 1% and greater. • Substrate Holders
In culverts located on higher gradient streams and those where culvert velocities at the FPDD exceed those in the natural channel, substrate holders can help to provide more low velocity zones.
Substrate holders are small weirs installed in the culvert to retain substrate in the culvert. The substrate provides additional roughness to reduce velocities, with an added benefit of flow variation. This method is typically effective for long culverts where backwater effects are lost.
Substrate holders are designed to hold an engineered streambed in the culvert while allowing for natural sediment transport processes to occur in the stream. for culverts ≤ 3 m in diameter, 200 mm high weirs should be used with Class 1M rock riprap, and
for culverts > 3 m in diameter, 300 mm high weirs should be installed with Class1 rock riprap. Caroline will show you pictures in her presentation.
The maximum spacing of the substrate holders is equivalent to the substrate holder height divided by the slope of the culvert. Currently the effect of these substrate holders is being researched. More information is available in the draft ‘Culverts and Fish Passage’.
Fish are energetically efficient and behavior and physiology play a big role in movement. A couple of other points to bring up. Sockeye salmon migrating 1000 km up the Fraser River to spawn will use a strategy that sail boaters use when trying to move against the wind. In the salmon’s case it is trying to move against the current (when they can) instead of facing it straight on. It’s referred to as tacking.
There are also energetic advantages to being in a school of fish. ‘Fish, famously, have no need for bicycles, but schools of fish swim as though they were cyclists. Just like a Tour de France peloton, fish at the back of a school use the slipstream created by the stronger fish out in front to swim with less effort.’
Fish swim in schools partly to evade predators and partly to improve their chances foraging for food. Until now, it was thought that these groups were egalitarian structures in which all members benefited equally in food terms, regardless of their position.
"Fish with higher rates of tail movement would have been working harder to propel themselves forward and therefore spending more energy," he said. "An analogy would be human runners: those taking the most steps each minute are those having to spend the most energy.“ The researchers estimated that when the school was swimming at 30 centimetres per second, trailing fish were having to work 12% less hard compared with the fish they were following.
"One of the most interesting things that these results hint at is that there may be differences in energy demand or performance capacity between schools in the wild. It wouldn't be smart for a fish to join a school with others that are much slower or faster than it is."
As we’ve said Nobody knows a lot about fish swimming dynamics.