Download
1 / 54
550 likes | 1.03k Vues
Soaps and Other Detergents . Brian Amato Daniel Froats Eileen Min Byul Kim Maegan Nevins. Agenda. Introduction Industry Analysis Advertising Strategies Recommendations. Why the Industry?. Ad -to-Sales Ratio Highly Saturated Market Overall Spending . Industry Analysis.

E N D
Soaps and Other Detergents Brian Amato Daniel Froats Eileen Min Byul Kim Maegan Nevins
Agenda Introduction Industry Analysis Advertising Strategies Recommendations
Why the Industry? Ad-to-Sales Ratio Highly Saturated Market Overall Spending
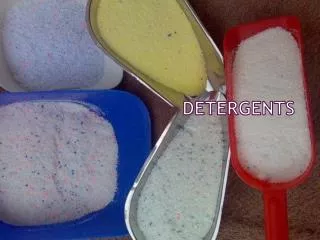
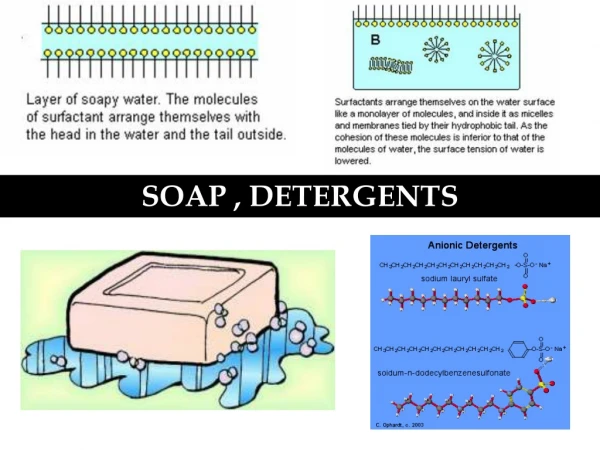
Industry Definition • Industry that produces substances that loosen and remove soil from a surface for personal hygiene, sanitation or cleaning clothes, linens and furnishings • Major Products • Primary Activities • Manufacturing & packaging soap • Preparing, manufacturing, and packaging cleaning compounds
Industry Structure • HHI = 562.7 • Calculated using top-5 companies • Slightly skewed by “Others” of 54.6% of small other firms • C4= 40.5%
Industry Structure • The US soap and detergent manufacturing industry includes about 650 companies with combined annual revenue of about $27 billion • The industry is highly concentrated: the top 50 companies generate about 90% of revenue
Industry Structure:Barriers to Entry – Medium Capital Intensity Competition Concentration Life Cycle Stage (Mature) Regulation and Policy Technology Change Industry Assistance
Industry Analysis Customer Segment Commercial Segment Industrial and commercial laundries, hotels, restaurants, and healthcare providers • Supermarket chains, mass merchandisers, drug stores, and warehouse clubs
Costs Producer Consumer • Ingredient costs 35-40% of the wholesale price • The price of surfactants and related chemicals can fluctuate and affect profitability
Producer Production Cost Consumer Consumption Cost
Employment • Due to the high level of automation at many manufacturing facilities, most production jobs require few skills • Average hourly wages are slightly lower than the national average
Industry Employment Growth Average Hourly Earnings & Annual Wage Increase
Industry Trends • Low growth in market volume and wholesale pricing drives manufacturers to increase productivity to cut costs • High levels of automation and improved manufacturing technology have allowed soap and detergent manufacturers to increase output with fewer workers
Imports and Exports • The US is a net exporter of soaps and detergents; the value of exports is about twice that of imports. • Main exports nations: Canada, Mexico, Japan, South Korea, the UK • Most large companies have plants throughout the world. • US soap and detergent exports increased more than 70% between 2005 and 2010.
Role of Government • Federal, state, local, and foreign environmental and safety laws regulate hazardous materials used or produced • Some large companies are actively involved in cleaning contaminated sites due to past operations • Some companies are reformulating products to meet demand for “green” products
Why focus on P&G? • Advertising Expenditure • Highest Industry Market Share • Diverse Product Offerings
P&G Ad-Sales Ratio P&G’s ad-sales ratio has continuously increased Except for 2009 when it decreased by 0.79% This probably seems to be related to the financial crisis that happened late 2008 However, the ad-sales ratio soon recovered and P&G’s ad-sales ratio is higher than ever, being 11.28% in 2011
Primary Advertising Methods • Informative • “Slice of Life” • Comedy • Comparative
Advertising Mediums • Television • Print • Magazine • Social Media • Facebook, Google, Youtube, etc • Social Campaigns
Effective Medium? • Audio-visual media: TV, Exhibition, Window Display • Print media: Newspapers, Magazine
Ad Spending by Day of Week • This seems to show a sign of Pulsingstrategy • While P&G airs TV ads continuously throughout the week, the most is spent on Tuesdays and Thursdays.
Ad Spending by Day Part • Most products were aired: Prime time > overnight > Afternoon Daytime 2 • Most spent on Prime time(both total & average) • While total advertising expenditure of overnight time was high, the average cost of overnight time was relatively low • For afternoon daytime 2, it was rather consistent; all relatively high
Ad Spending by Network • Total advertising expenditure highest for Cable TV • However, on average, Network TV is the most expensive, then SLN TV, and Cable TV is the cheapest
Focus mostly on Slice-of-Life, Soap Opera, Feature Film, and Situation Comedy • Award/Celebration? • Average is highest; count and sum is very low
AdImpact by Program Type • High Performance? • Detergent: feature film, general drama, and news • Specialty soaps: popular music, instruction/advice offerings
TV Ad Content Analysis 1 Sustainability
“My Tide” Campaign “Tide Dad” “Dad’s Designer Jeans” Informative ad Highlighted attributes: preserves the original color of fabric, good on delicate fabric and high quality clothing Informative ad Highlighted attributes: good on children’s clothing, tough on stains and preserves the original look & feel of clothing
How is P&G Different? • Proctor & Gamble’s strategy of targeting several strategic niche markets • The power of storytelling • Strong brand value & brand equity
Print Advertising • Medium With Reliable Metrics • Innovative Ad Campaigns • Shift in Spending Toward Magazine Ads • Benefits of Targeted Media • Coupons/Promotions
“Loads of Hope” • Disaster Strikes • “A disaster occurs making relief necessary for the families affected” • Help is Sent • “We send our mobile laundromatfleet to the location” • Laundry is Provided • “We spend multiple days at the disaster site washing, drying and folding clothes for the families affected”
Social Media “As we’ve said historically, the 9% to 11% range [for advertising as a percentage of sales] has been what we have spent. Actually, I believe that over time, we will see the increase in the cost of advertising moderate. There are just so many different media available today and we’re quickly moving more and more of our businesses into digital. And in that space, there are lots of different avenues available. In the digital space, with things like Facebook and Google and others, we find that the return on investment of the advertising, when properly designed, when the big idea is there, can be much more efficient. One example is our Old Spice campaign, where we had 1.8 billion free impressions and there are many other examples I can cite from all over the world.” –Robert McDonald, CEO
“Future Friendly” Program/Sweepstakes • Facebook Based Sweepstakes • Celebrity Endorsement • Interactive Campaign • Special Events
Recommendations • Target Growing Hispanic Population • Focus on More Targeted Media • Innovative Use of Social Media
P&G: Great Long-term Investment • P&G has an aggressive global growth plan for the emerging markets in the years to come • Company Goal: 1 billion new customers by 2014-15 • New Manufacturing facilities in Brazil, Eastern Europe, India, and China
P&G: How to Accomplish Future Growth • New plant in LuogangChina • Up and running by 2013 • $490 million in product revenue • Reducing Costs: phase out non-manufacturing jobs in the U.S • 5700 layoffs helping the company reach its goal of 10 Billion in cost cutting measures by 2016