Download
1 / 1
10 likes | 114 Vues

E N D
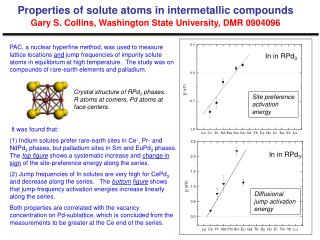
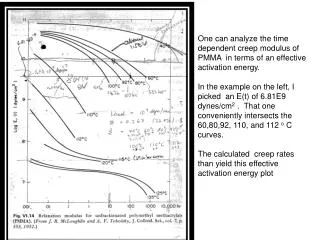
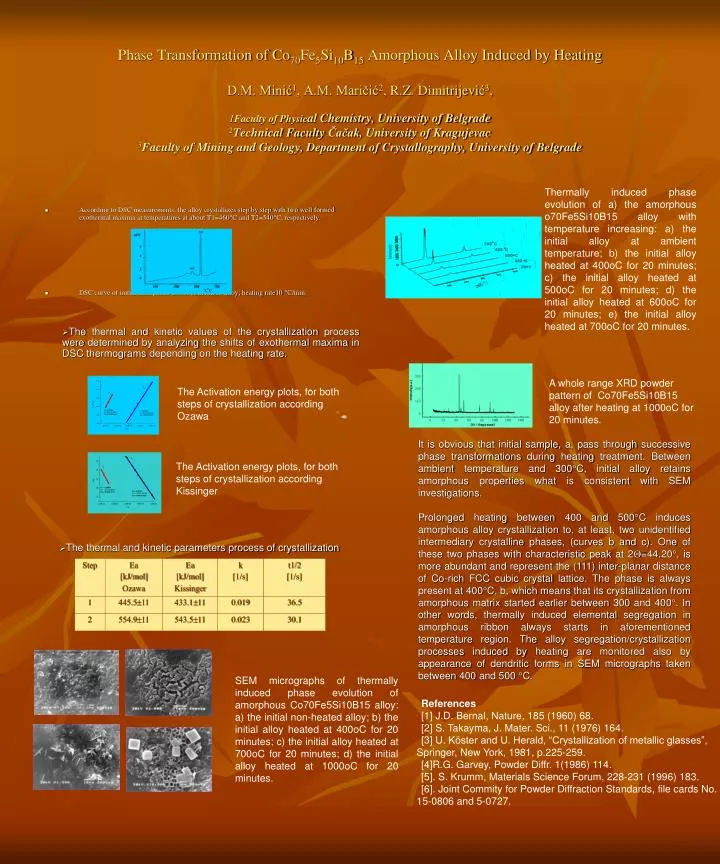
Phase Transformation of Co70Fe5Si10B15 Amorphous Alloy Induced by HeatingD.M. Minić1, A.M. Maričić2, R.Z. Dimitrijević3, 1Faculty of Physical Chemistry, University of Belgrade2Technical Faculty Čačak, University of Kragujevac3Faculty of Mining and Geology, Department of Crystallography, University of Belgrade Thermally induced phase evolution of a) the amorphous o70Fe5Si10B15 alloy with temperature increasing: a) the initial alloy at ambient temperature; b) the initial alloy heated at 400oC for 20 minutes; c) the initial alloy heated at 500oC for 20 minutes; d) the initial alloy heated at 600oC for 20 minutes; e) the initial alloy heated at 700oC for 20 minutes. • According to DSC measurements, the alloy crystallizes step by step with two well formed exothermal maxima at temperatures at about T1=460C and T2=540C, respectively. • DSC curve of initial amorphous Co70Fe5Si10B15 alloy; heating rate10 C/min. • The thermal and kinetic values of the crystallization process were determined by analyzing the shifts of exothermal maxima in DSC thermograms depending on the heating rate. A whole range XRD powder pattern of Co70Fe5Si10B15 alloy after heating at 1000oC for 20 minutes. The Activation energy plots, for both steps of crystallization according Ozawa a) c) b) a) c) d) It is obvious that initial sample, a, pass through successive phase transformations during heating treatment. Between ambient temperature and 300C, initial alloy retains amorphous properties what is consistent with SEM investigations. Prolonged heating between 400 and 500C induces amorphous alloy crystallization to, at least, two unidentified intermediary crystalline phases, (curves b and c). One of these two phases with characteristic peak at 2=44.20, is more abundant and represent the (111) inter-planar distance of Co-rich FCC cubic crystal lattice. The phase is always present at 400C, b, which means that its crystallization from amorphous matrix started earlier between 300 and 400. In other words, thermally induced elemental segregation in amorphous ribbon always starts in aforementioned temperature region. The alloy segregation/crystallization processes induced by heating are monitored also by appearance of dendritic forms in SEM micrographs taken between 400 and 500 C. The Activation energy plots, for both steps of crystallization according Kissinger • The thermal and kinetic parameters process of crystallization SEM micrographs of thermally induced phase evolution of amorphous Co70Fe5Si10B15 alloy: a) the initial non-heated alloy; b) the initial alloy heated at 400oC for 20 minutes; c) the initial alloy heated at 700oC for 20 minutes; d) the initial alloy heated at 1000oC for 20 minutes. References [1] J.D. Bernal, Nature, 185 (1960) 68. [2] S. Takayma, J. Mater. Sci., 11 (1976) 164. [3] U. Köster and U. Herald, “Crystallization of metallic glasses”, Springer, New York, 1981, p.225-259. [4]R.G. Garvey, Powder Diffr. 1(1986) 114. [5]. S. Krumm, Materials Science Forum, 228-231 (1996) 183. [6]. Joint Commity for Powder Diffraction Standards, file cards No. 15-0806 and 5-0727.