Download
1 / 6
320 likes | 1.33k Vues
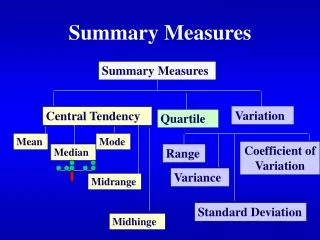
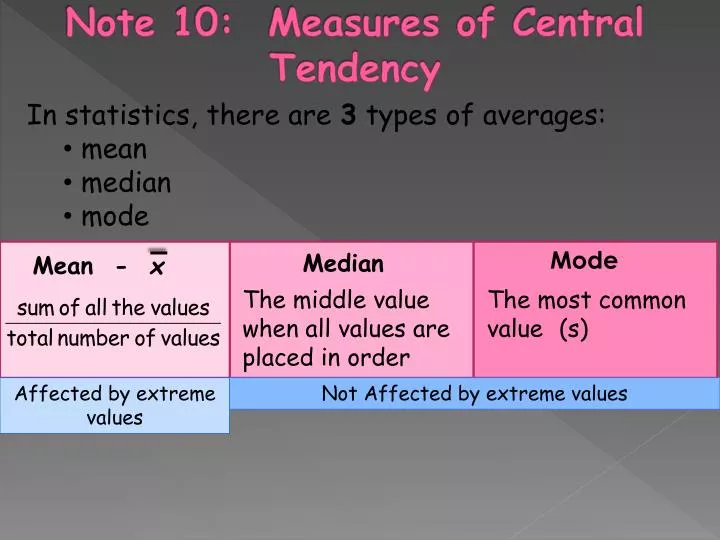
Note 10: Measures of Central Tendency. In statistics, there are 3 types of averages: mean median mode. Mode. Median. Mean - x. The middle value when all values are placed in order. The most common value (s). Affected by extreme values. Not Affected by extreme values. Example:.

E N D
Note 10: Measures of Central Tendency • In statistics, there are 3 types of averages: • mean • median • mode Mode Median Mean - x The middle value when all values are placed in order The most common value (s) Affected by extreme values Not Affected by extreme values
Example: Calculate the mean, median, and mode for this set of numbers 35 95 29 95 49 82 78 48 14 92 1 82 43 89 Arrange the numbers in order 1 14 29 35 43 48 49 78 82 82 89 92 95 95 median Mean – Median – halfway between 49 and 78, i.e. = 63.5 Mode – 82
Averages from a Frequency Table Why is this mean misleading? Most students either do not buy their lunch at the canteen or buy it there every day. Calculate the mean = = = 2.3
The most common number of times people visit the canteen is no times The median number of times students visit the canteen is the 17th data value. Adding the frequencies: 11 + 4 = 15 visited the canteen 1 time or fewer 11 + 4 + 3 = 18 visited the canteen 2 times or fewer Median must be 2 visits to the canteen.
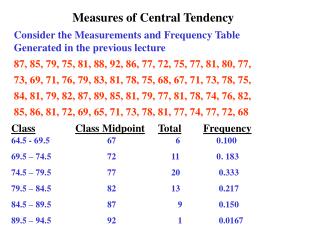
For grouped data the midpoint of the interval, m, is used instead of the exact x-values. f.m values are calculated and totaled.
Page 251 Exercise C and D