Download
1 / 47
470 likes | 665 Vues
Tabulate, chart, map, download: Pre-tabulated health indicators. Objectives. By the end of today’s workshop, you should: Understand the website’s general benefits and limitations Know how to navigate to and through the Health Indicators Warehouse website

E N D
Tabulate, chart, map, download: Pre-tabulated health indicators
Objectives • By the end of today’s workshop, you should: • Understand the website’s general benefits and limitations • Know how to navigate to and through the Health Indicators Warehouse website • Be able to locate indicators of interest • Be able to download indicatordata
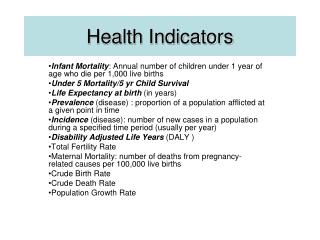
Definition: HEALTH INDICATOR • A measurable characteristic that describes: • the health of a population (e.g., life expectancy, mortality, disease incidence or prevalence, or other health states); • determinants of health (e.g., health behaviors, health risk factors, physical environments, and socioeconomic environments); • health care access, cost, quality, and use.
Definition: HEALTH INDICATOR • Depending on the measure, a health indicator may be defined for a specific population, place, political jurisdiction, or geographic area.
Emerging Health Data Trends & Issues • Many data sources, old and new • Surveys (national, state, local), government/administrative records, Electronic Health Records, Health Information Exchange • Varying degrees of rigor and compatibility
Emerging Health Data Trends & Issues • Growing demand for more and better community-level measures of health and health determinants: HEALTH INDICATORS • Census, vital statistics, state-collected surveillance data, Behavioral Risk Factor Surveillance Survey (BRFSS) data • Small sample survey sizes; large standard errors; limited subgroup information; comparability issues
What is the Health Indicators Warehouse (HIW)? • Contains pre-tabulated national, state, and county level indicators • no individual-level data • Allows users to map, chart, tabulate, and download indicators • Provides links from indicators to evidence-based interventions
What is the Health Indicators Warehouse (HIW)? • Includes health and demographic measures: • Healthy People 2020 • County Health Rankings • Community Health Status Indicators • community-level Medicare utilization and quality indicators
Benefits of the HIW • Provides metadata, with descriptions of methodology and data sources, allowing for better understanding of strengths and weaknesses of indicators • Links to original data sources • Facilitates harmonization across data sources and methodologies • Allows users to examine, select and download indicator both data and metadata, either through the interface (in Excel or CSV) or through web services
Data sources • Over 200 data sources, including: • Federal: • Bureau of Census • Federal surveys from the Departments of Health and Human Services, Education, and Agriculture • Surveillance data • Medicare administrative data • EPA modeled data • State: • Behavioral Risk Factor Surveillance Survey (BRFSS) • Surveillance system data
Data sources • Over 200 data sources, including: • Professional Associations: • American Medical Association • American Dental Association • other health professions data • NGOs: • Association of State and Territorial Health Officials (ASTHO) • National Association of County and City Health Officials (NACCHO) • American Heart Association • other member surveys
Current version of the HIW • Approximately 1,170 unique indicators in the warehouse at the national, state and/or local levels • Over 1,000 indicators at the national level • Over 250 indicators at the state level • Around 80 indicators at the county level • Over 170 Medicare and Medicaid indicators at the hospital referral region (HRR) level
Some considerations • Estimates may be single-year or multiple-year • Pooled years for greater precision in some cases • Ability to show estimates for demographic sub-groups • Some tables will have time trends • Data suppression • Some estimates may be suppressed based on small numbers or on the basis of confidentiality, as defined by the data provider.
Live Demonstration of the Health Indicators Warehouse http://www.healthindicators.gov
How to … • Find an indicator • Interpret metadata • Show indicator data in a table • View data by different geographies • Select various demographic dimensions • Create charts • Create maps • Download data • Additional Resources
How to … • Find an indicator • Interpret metadata • Show indicator data in a table • View data by different geographies • Select various demographic dimensions • Create charts • Create maps • Download data • Additional Resources
How to … • Find an indicator • Interpret metadata • Show indicator data in a table • View data by different geographies • Select various demographic dimensions • Create charts • Create maps • Download data • Additional Resources
How to … • Find an indicator • Interpret metadata • Show indicator data in a table • View data by different geographies • Select various demographic dimensions • Create charts • Create maps • Download data • Additional Resources
How to … • Find an indicator • Interpret metadata • Show indicator data in a table • View data by different geographies • Select various demographic dimensions • Create charts • Create maps • Download data • Additional Resources
How to … • Find an indicator • Interpret metadata • Show indicator data in a table • View data by different geographies • Select various demographic dimensions • Create charts • Create maps • Download data • Additional Resources
How to … • Find an indicator • Interpret metadata • Show indicator data in a table • View data by different geographies • Select various demographic dimensions • Create charts • Create maps • Download data • Additional Resources
How to … • Find an indicator • Interpret metadata • Show indicator data in a table • View data by different geographies • Select various demographic dimensions • Create charts • Create maps • Download data • Additional Resources
How to … • Find an indicator • Interpret metadata • Show indicator data in a table • View data by different geographies • Select various demographic dimensions • Create charts • Create maps • Download data • Additional Resources
Exercise #1: Nursing Home Facilities • Using an indicator table, find the state which had the greatest number of Medicare or Medicaid-certified Nursing home (Title 18/19) facilities in 2010. • Show this same information for 2010 using a bar chart, by state. • For that particular state, what are the top two hospital referral regions containing the highest number of facilities? • Show this information for 2010 using a map, by hospital referral region.
Exercise #1: Nursing Home Facilities California Florida Pennsylvania
Exercise #2: Obesity • What is the proportion of non-Hispanic whites in the US who are obese? • What was the proportion of persons in Washington DC that were obese in 2010? • HINT: you can look up “adult obesity” as a keyword
Exercise #2: Obesity READ THE METADATA!
Help / Contact Us To receive technical support with the Health Indicators Warehouse: e-mail: Healthindicators@cdc.gov