Download
1 / 68
680 likes | 945 Vues
Using Bootstrapping and Randomization to Introduce Statistical Inference. Robin H. Lock, Burry Professor of Statistics Patti Frazer Lock, Cummings Professor of Mathematics St. Lawrence University USCOTS 2011 Raleigh, NC. The Lock 5 Team. Dennis Iowa State. Kari Harvard/Duke. Eric

E N D
Using Bootstrapping and Randomization to Introduce Statistical Inference Robin H. Lock, Burry Professor of Statistics Patti Frazer Lock, Cummings Professor of Mathematics St. Lawrence University USCOTS 2011 Raleigh, NC
The Lock5 Team Dennis Iowa State Kari Harvard/Duke Eric UNC- Chapel Hill Robin & Patti St. Lawrence
Question Can you use your clicker? A. Yes B. No C. Not sure D. I don’t have a clicker
Setting Intro Stat – an introductory statistics course for undergraduates “introductory” ==> no formal stat pre-requisite AP Stat counts as “undergraduate”
Question Do you teach a Intro Stat? A. Very regularly (most semesters) B. Regularly (most years) C. Occasionally D. Rarely (every few years) E. Never
Question Have you used randomization methods in Intro Stat? A. Yes, as a significant part of the course B. Yes, as a minor part of the course C. No D. What are randomization methods?
Question Have you used randomization methods in any statistics class that you teach? A. Yes, as a significant part of the course B. Yes, as a minor part of the course C. No D. What are randomization methods?
Descriptive Statistics – one and two samples • Normal distributions Intro Stat - Traditional Topics • Data production (samples/experiments) • Sampling distributions (mean/proportion) • Confidence intervals (means/proportions) • Hypothesis tests (means/proportions) • ANOVA for several means, Inference for regression, Chi-square tests
Choose an order to teach standard inference topics: _____ Test for difference in two means _____ CI for single mean _____ CI for difference in two proportions _____ CI for single proportion _____ Test for single mean _____ Test for single proportion _____ Test for difference in two proportions _____ CI for difference in two means QUIZ
Descriptive Statistics – one and two samples ? ? • Normal distributions Intro Stat – Revise the Topics • Bootstrap confidence intervals • Bootstrap confidence intervals • Data production (samples/experiments) • Data production (samples/experiments) • Randomization-based hypothesis tests • Randomization-based hypothesis tests • Sampling distributions (mean/proportion) • Normal/sampling distributions • Confidence intervals (means/proportions) • Hypothesis tests (means/proportions) • ANOVA for several means, Inference for regression, Chi-square tests
Question Data Description: Summary statistics & graphs Data Production: Sampling & experiments What is your preferred order? A. Description, then Production B. Production, then Description C. Mix them up
Example: Reese’s Pieces Sample: 52/100 orange Where might the “true” p be?
“Bootstrap” Samples Key idea: Sample with replacement from the original sample using the same n. Imagine the “population” is many, many copies of the original sample.
Simulated Reese’s Population Sample from this “population”
Creating a Bootstrap Sample:Class Activity? What proportion of Reese’s Pieces are orange? Original Sample: 52 orange out of 100 pieces How can we create a bootstrap sample? • Select a candy (at random) from the original sample • Record color (orange or not) • Put it back, mix and select another • Repeat until sample size is 100
Creating a Bootstrap Distribution 1. Compute a statistic of interest (original sample). 2. Create a new sample with replacement (same n). 3. Compute the same statistic for the new sample. 4. Repeat 2 & 3 many times, storing the results. 5. Analyze the distribution of collected statistics. Time for some technology…
Example: Atlanta Commutes What’s the mean commute time for workers in metropolitan Atlanta? Data: The American Housing Survey (AHS) collected data from Atlanta in 2004.
Sample of n=500 Atlanta Commutes n = 500 29.11 minutes s = 20.72 minutes Where might the “true” μ be?
Creating a Bootstrap Distribution 1. Compute a statistic of interest (original sample). 2. Create a new sample with replacement (same n). 3. Compute the same statistic for the new sample. 4. Repeat 2 & 3 many times, storing the results. 5. Analyze the distribution of collected statistics. Time for some technology…
Bootstrap Distribution of 1000 Atlanta Commute Means Std. dev of ’s=0.93 Mean of ’s=29.09
Using the Bootstrap Distribution to Get a Confidence Interval – Version #1 The standard deviation of the bootstrap statistics estimates the standard error of the sample statistic. Quick interval estimate : For the mean Atlanta commute time:
Using the Bootstrap Distribution to Get a Confidence Interval – Version #2 95% CI=(27.24,31.03) 27.24 31.03 Chop 2.5% in each tail Chop 2.5% in each tail Keep 95% in middle For a 95% CI, find the 2.5%-tile and 97.5%-tile in the bootstrap distribution
90% CI for Mean Atlanta Commute 90% CI=(27.60,30.61) 27.60 30.61 Keep 90% in middle Chop 5% in each tail Chop 5% in each tail For a 90% CI, find the 5%-tile and 95%-tile in the bootstrap distribution
99% CI for Mean Atlanta Commute 99% CI=(26.73,31.65) 26.73 31.65 Keep 99% in middle Chop 0.5% in each tail Chop 0.5% in each tail For a 99% CI, find the 0.5%-tile and 99.5%-tile in the bootstrap distribution
Bootstrap Confidence Intervals Version 1 (2 SE): Great preparation for moving to traditional methods Version 2 (percentiles): Great at building understanding of confidence intervals
Using the Bootstrap Distribution to Get a Confidence Interval Ex: NFL uniform “malevolence” vs. Penalty yards r = 0.430 Find a 95% CI for correlation Try web applet
-0.053 0.729 0.430
Using the Bootstrap Distribution to Get a Confidence Interval – Version #3 0.483 0.299 0.430 -0.053 0.729 “Reverse” Percentile Interval: Lower: 0.430 – 0.299 = 0.131 Upper: 0.430 + 0.483 = 0.913
Question Which of these methods for constructing a CI from a bootstrap distribution should be used in Intro Stat? (choosing more than one is fine) #1: +/- multiple of SE #2: Percentile #3: Reverse percentile A. Yes B. No C. Unsure A. Yes B. No C. Unsure A. Yes B. No C. Unsure
Question Which of these methods for constructing a CI from a bootstrap distribution should be used in Intro Stat? (choosing more than one is fine) #1: +/- multiple of SE #2: Percentile #3: Reverse percentile A. Yes B. No C. Unsure
Question Which of these methods for constructing a CI from a bootstrap distribution should be used in Intro Stat? (choosing more than one is fine) #1: +/- multiple of SE #2: Percentile #3: Reverse percentile A. Yes B. No C. Unsure
Question Which of these methods for constructing a CI from a bootstrap distribution should be used in Intro Stat? (choosing more than one is fine) #1: +/- multiple of SE #2: Percentile #3: Reverse percentile A. Yes B. No C. Unsure
“Randomization” Samples Key idea: Generate samples that are consistent with the null hypothesis AND based on the sample data.
Example: Cocaine Treatment Conditions (assigned at random): Group A:Desipramine Group B:Lithium Response: (binary categorical) Relapse/No relapse
Treating Cocaine Addiction Randomly assign to Desipramine or Lithium Start with 48 subjects Record the data: Relapse/No Relapse Group A: Desipramine Group A: Desipramine Group B: Lithium Group B: Lithium
Cocaine Treatment Results Is this difference “statistically significant”?
Key idea: Generate samples that are(a) consistent with the null hypothesis (b) based on the sample data. H0: Drug doesn’t matter
Key idea: Generate samples that are(a) consistent with the null hypothesis (b) based on the sample data. In 48 addicts, there are 28 relapsers and 20 no-relapsers. Randomly split them into two groups. How unlikely is it to have as many as 14 of the no-relapsers in the Desipramine group?
Cocaine Treatment- Simulation 1. Start with a pack of 48 cards (the addicts). 28 Relapse: Cards 3 – 9 20 Don’t relapse: Cards 10,J,Q,K,A 2. Shuffle the cards and deal 24 at random to form the Desipramine group (Group A). 3. Count the number of “No Relapse” cards in simulated Desipramine group. 4. Repeat many times to see how often a random assignment gives a count as large as the experimental count (14) to Group A. Automate this
Distribution for 1000 Simulations Number of “No Relapse” in Desipramine group under random assignments 28/1000
Understanding a p-value The p-value is the probability of seeing results as extreme as the sample results, if the null hypothesis is true.
Example: Mean Body Temperature Is the average body temperature really 98.6oF? H0:μ=98.6 Ha:μ≠98.6 Data: A random sample of n=50 body temperatures. n = 50 98.26 s = 0.765 Data from Allen Shoemaker, 1996 JSE data set article
Key idea: Generate samples that are(a) consistent with the null hypothesis (b) based on the sample data. How to simulate samples of body temperatures to be consistent with H0: μ=98.6? H0: μ=98.6 Sample: n = 50, 98.26, s = 0.765
Randomization Samples How to simulate samples of body temperatures to be consistent with H0: μ=98.6? • Add 0.34 to each temperature in the sample (to get the mean up to 98.6). • Sample (with replacement) from the new data. • Find the mean for each sample (H0 is true). • See how many of the sample means are as extreme as the observed 98.26.
Randomization Distribution 98.26 Looks pretty unusual… p-value ≈ 1/1000 x 2 = 0.002
Connecting CI’s and Tests Randomization body temp means when μ=98.6 Bootstrap body temp means from the original sample Fathom Demo
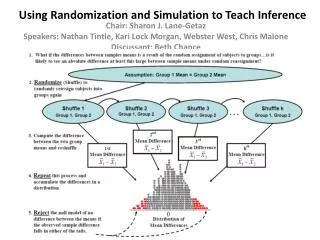
Choosing a Randomization Method Example: Finger tap rates (Handbook of Small Datasets) H0: μA=μB vs. Ha: μA>μB Reallocate Option 1: Randomly scramble the A and B labels and assign to the 20 tap rates. Resample Option 2: Combine the 20 values, then sample (with replacement) 10 values for Group A and 10 values for Group B.