Download
1 / 50
530 likes | 720 Vues
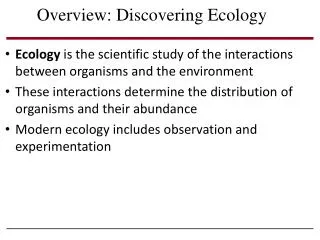
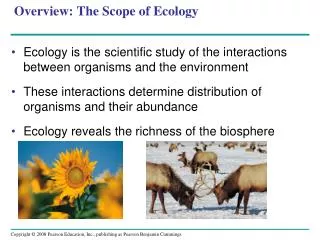
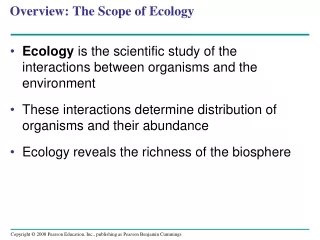
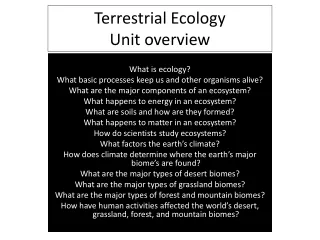
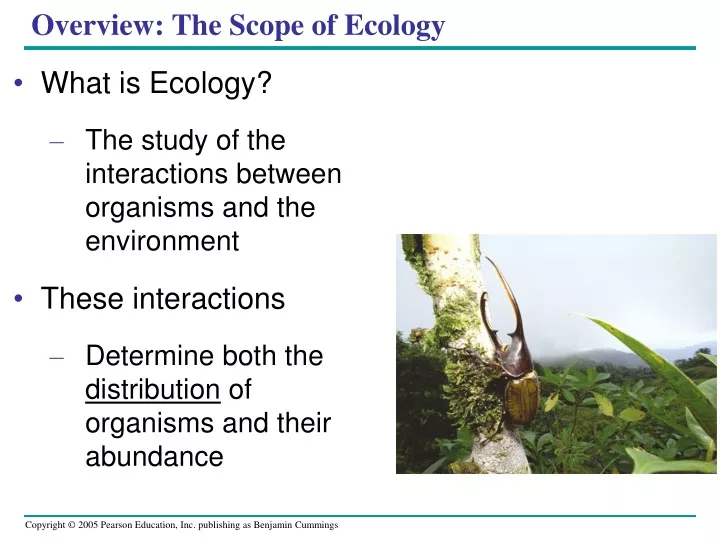
Overview: The Scope of Ecology. What is Ecology? The study of the interactions between organisms and the environment These interactions Determine both the distribution of organisms and their abundance. Organisms and the Environment. What does the environment of an organism include?

E N D
Overview: The Scope of Ecology • What is Ecology? • The study of the interactions between organisms and the environment • These interactions • Determine both the distribution of organisms and their abundance
Organisms and the Environment • What does the environment of an organism include? • Abiotic, or nonliving components • Biotic, or living components • All the organisms living in the environment, the biota
The biosphere • Is the global ecosystem, the sum of all the planet’s ecosystems
Ecosystems (Biomes) focus on energy flow and chemical cycling among the various ______ and __________components in broad geographic regions of land or water (d) Ecosystem ecology. Whatfactors control photosyntheticproductivity in a temperategrassland ecosystem? Figure 50.3d
30N Tropic of Cancer Equator Tropic of Capricorn 30S Chaparral Tundra Key Temperate grassland High mountains Tropical forest Temperate broadleaf forest Polar ice Savanna Coniferous forest Desert Why are particular terrestrial biomes are found in certain areas?
30N Tropic of Cancer Equator Continentalshelf Tropic of Capricorn 30S Key Rivers Abyssal zone(below oceanicpelagic zone) Lakes Estuaries Intertidal zone Coral reefs Oceanic pelagiczone Aquatic Biomes • largest part of the biosphere in terms of area • Can contain fresh or salt water (ocean = 75%) Figure 50.15
Community ecology • Deals with the whole array of interacting species in a community (c) Community ecology.What factors influencethe diversity of speciesthat make up aparticular forest? Figure 50.3c
Population ecology. What environmental factors affect the reproductive rate of deer mice? (b) • Population ecology • Concentrates mainly on factors that affect how many individuals of a particular species live in an area Figure 50.3b
(a) Organismal ecology. How do humpback whales select their calving areas? Subfields of Ecology • Organismal ecology • Studies how an organism’s structure, physiology, and (for animals) behavior meet the challenges posed by the environment Figure 50.3a
Figure 50.4 Ecology and Environmental Issues • Ecology • Provides the scientific understanding underlying environmental issues • Rachel Carson • Is credited with starting the modern environmental movement
Climate in northern Australia is hot and wet, with seasonal drought. Kangaroos/km2 > 20 10–20 5–10 1–5 0.1–1 Red kangaroos occur in most semiarid and arid regions of the interior, where precipitation is relatively low and variable from year to year. < 0.1 Limits ofdistribution Southeastern Australia has a wet, cool climate. Southern Australia has cool, moist winters and warm, dry summers. Tasmania • How do environmental components affect the distribution and abundance of organisms? Figure 50.2
Species absent because Area inaccessible or insufficient time Yes Yes Dispersallimitsdistribution? Habitat selection Yes Predation, parasitism,competition, disease Chemical factors Behaviorlimitsdistribution? Biotic factors(other species)limitdistribution? No WaterOxygen Salinity pHSoil nutrients, etc. No Abiotic factorslimitdistribution? No TemperatureLight Soil structure FireMoisture, etc. Physical factors • Biogeography • Provides a good starting point for understanding what limits the geographic distribution of species Figure 50.6
New areasoccupied Year 1996 1989 1974 Dispersal and Distribution • What is Dispersal? • movement of individuals away from their area of origin • Contributes to distribution of organisms
Invasive Species or Species transplants • organisms intentionally or accidentally relocated • Can often disrupt the communities or ecosystems to which they have been introduced
Biotic Factors • Biotic factors that affect the distribution of organisms may include • Interactions with other species • Predation • Competition
W. J. Fletcher tested the effects of two algae-eating animals, sea urchins and limpets, on seaweed abundance near Sydney, Australia. In areas adjacent to a control site, either the urchins, the limpets, or both were removed. EXPERIMENT Fletcher observed a large difference in seaweed growth between areas with and without sea urchins. RESULTS Removing bothlimpets andurchins orremoving onlyurchins increasedseaweed coverdramatically. 100 Seaurchin Both limpetsand urchinsremoved 80 Onlyurchinsremoved 60 Seaweed cover (%) Limpet 40 Almost noseaweed grew in areas whereboth urchins andlimpets werepresent, or whereonly limpets wereremoved. Only limpets removed Control (bothurchins andlimpets present) 20 0 February 1984 February 1983 August 1983 August 1982 Removing both limpets and urchins resulted in the greatest increase of seaweed cover, indicating that bothspecies have some influence on seaweed distribution. But since removing only urchins greatly increased seaweed growth whileremoving only limpets had little effect, Fletcher concluded that sea urchins have a much greater effect than limpets in limitingseaweed distribution. CONCLUSION What limits the seaweed distribution? Figure 50.8
Abiotic Factors • Abiotic factors that affect the distribution of organisms may include • Temperature • Water • Sunlight • Salinity • Wind • Rocks and soil
Wind • Wind • Amplifies the effects of temperature on organisms by increasing heat loss due to evaporation and convection • Can change the morphology of plants Figure 50.9
Rocks and Soil • Many characteristics of soil limit the distribution of plants and thus the animals that feed upon them • Physical structure • pH • Mineral composition
Climate patterns can be described on two scales • Macroclimate • global, regional, and local level • Microclimate • very small, ie community of organisms underneath a fallen log
LALITUDINAL VARIATION IN SUNLIGHT INTENSITY North Pole60N Low angle of incoming sunlight 30N Tropic ofCancer Sunlight directly overhead 0 (equator) Tropic ofCapricorn 30S Low angle of incoming sunlight 60S South pole Figure 50.10 Atmosphere Solar Energy impacts global climate • Sunlight intensity determines the Earth’s climate patterns
SEASONAL VARIATION IN SUNLIGHT INTENSITY March equinox: Equator faces sun directly; neither pole tilts toward sun; all regions on Earth experience 12 hours of daylight and 12 hours of darkness. 60N June solstice: Northern Hemisphere tilts toward sun; summer begins in Northern Hemisphere; winter begins in Southern Hemisphere. 30N 0 (equator) 30S December solstice: Northern Hemisphere tilts away from sun; winter begins in Northern Hemisphere; summer begins in Southern Hemisphere. Constant tilt of 23.5 September equinox: Equator faces sun directly; neither pole tilts toward sun; all regions on Earth experience 12 hours of daylight and 12 hours of darkness. Figure 50.10
GLOBAL AIR CIRCULATION AND PRECIPITATION PATTERNS 60N 30N Descending dry air absorbs moisture Descending dry air absorbs moisture 0 (equator) Ascending moist air releases moisture 30S 0 23.5 60S 23.5 30 30 Aridzone Aridzone Tropics • Air circulation and wind patterns • Play major parts in determining the Earth’s climate patterns Figure 50.10
GLOBAL WIND PATTERNS ArcticCircle 60N Westerlies 30N Northeast trades Doldrums 0 (equator) Southeast trades 30S Westerlies 60S AntarcticCircle Figure 50.10
Warm air over land rises. 1 Cooler air sinks over water. 3 Air cools at high elevation. 2 Cool air over water moves inland, replacing rising warm air over land. 4 Bodies of Water • Oceans and their currents, and large lakes • Moderate the climate of nearby terrestrial environments Figure 50.11
As moist air moves in off the Pacific Ocean and encounters the westernmost mountains, it flows upward, cools at higher altitudes, and drops a large amount of water. The world’s tallest trees, the coastal redwoods, thrive here. 1 Farther inland, precipitation increases again as the air moves up and over higher mountains. Some of the world’s deepest snow packs occur here. 2 On the eastern side of the Sierra Nevada, there is little precipitation. As a result of this rain shadow, much of central Nevada is desert. 3 Wind direction East PacificOcean Sierra Nevada CoastRange Figure 50.12 Mountains • Mountains have a significant effect on • The amount of sunlight reaching an area • Local temperature • Rainfall
In autumn, as surface water cools rapidly, it sinks below the underlying layers, remixing the water until the surface begins to freeze and the winter temperature profile is reestablished. In winter, the coldest water in the lake (0°C) lies just below the surface ice; water is progressively warmer at deeper levels of the lake, typically 4–5°C at the bottom. In summer, the lake regains a distinctive thermal profile, with warm surface water separated from cold bottom water by a narrow vertical zone of rapid temperature change, called a thermocline. 1 4 3 8 8 In spring, as the sun melts the ice, the surface water warms to 4°C and sinks below the cooler layers immediately below, eliminating the thermal stratification. Spring winds mix the water to great depth, bringing oxygen (O2) to the bottom waters (see graphs) and nutrients to the surface. 2 16 16 24 24 Spring O2 (mg/L) Winter O2 (mg/L) 0 4 8 12 0 8 12 4 Lake depth (m) Lake depth (m) 8 16 24 O2 concentration High Medium Low 4 0 O2 (mg/L) 4 2 O2 (mg/L) 4 4 8 0 4 12 0 4 8 12 4 4 Lake depth (m) Lake depth (m) 4 4 22 4 8 20 4 4C 4C 4 18 4 16 8 6 4 5 4C 24 4C Autumn Thermocline Summer • Lakes • Are sensitive to seasonal temperature change • Experience seasonal turnover Figure 50.13
Current range Predictedrange Overlap (a) 4.5C warming overnext century (b) 6.5C warming overnext century Long-Term Climate Change • One way to predict future global climate change • Is to look back at the changes that occurred previously Figure 50.14
30N Tropic of Cancer Equator Continentalshelf Tropic of Capricorn 30S Key Rivers Abyssal zone(below oceanicpelagic zone) Lakes Estuaries Intertidal zone Coral reefs Oceanic pelagiczone Aquatic Biomes • largest part of the biosphere in terms of area • Can contain fresh or salt water (ocean = 75%) Figure 50.15
Intertidal zone Neritic zone Oceanic zone Littoralzone Limneticzone 0 Photic zone 200 m Continentalshelf Pelagic zone Benthiczone Aphoticzone Photiczone Pelagiczone Benthiczone Aphoticzone (a) Zonation in a lake. The lake environment is generally classified on the basis of three physical criteria: light penetration (photic and aphotic zones), distance from shore and water depth (littoral and limnetic zones), and whether it is open water (pelagic zone) or bottom (benthic zone). 2,500–6,000 m Abyssal zone(deepest regions of ocean floor) (b) Marine zonation. Like lakes, the marine environment is generally classified on the basis of light penetration (photic and aphotic zones), distance from shore and water depth (intertidal, neritic, and oceanic zones), and whether it is open water (pelagic zone) or bottom (benthic and abyssal zones). • Many aquatic biomes • Are stratified into zones or layers defined by light penetration, temperature, and depth Figure 50.16a, b
LAKES An oligotrophic lake in Grand Teton, Wyoming A eutrophic lake in Okavango delta, Botswana • Lakes Figure 50.17
WETLANDS Figure 50.17 Okefenokee National Wetland Reserve in Georgia • Wetlands
STREAMS AND RIVERS A headwater stream in theGreat Smoky Mountains The Mississippi River farform its headwaters Figure 50.17 • Streams and rivers
ESTUARIES Figure 50.17 An estuary in a low coastal plain of Georgia • Estuaries
INTERTIDAL ZONES Figure 50.17 Rocky intertidal zone on the Oregon coast • Intertidal zones
OCEANIC PELAGIC BIOME Figure 50.17 Open ocean off the island of Hawaii • Oceanic pelagic biome
CORAL REEFS Figure 50.17 A coral reef in the Red Sea • Coral reefs
MARINE BENTHIC ZONE Figure 50.17 A deep-sea hydrothermal vent community • Marine benthic zone
30N Tropic of Cancer Equator Tropic of Capricorn 30S Chaparral Tundra Key Temperate grassland High mountains Tropical forest Temperate broadleaf forest Polar ice Savanna Coniferous forest Desert Why are particular terrestrial biomes are found in certain areas?
Temperate grassland Desert Tropical forest 30 Temperate broadleaf forest 15 Annual mean temperature (ºC) Coniferous forest 0 Arctic and alpine tundra 15 100 200 300 400 Annual mean precipitation (cm) Climate and Terrestrial Biomes • What impact does Climate have on the distribution of organisms in the climograph? Figure 50.18
30N Tropic of Cancer Equator Tropic of Capricorn 30S Chaparral Tundra Key Temperate grassland High mountains Tropical forest Temperate broadleaf forest Polar ice Savanna Coniferous forest Desert Major terrestrial biomes • Are named for major physical or climatic factors and for their predominant vegetation Figure 50.19
TROPICAL FOREST Figure 50.20 A tropical rain forest in Borneo Tropical forest • Focus on the stratification in terrestrial biomes
DESERT Figure 50.20 The Sonoran Desert in southern Arizona • Desert
SAVANNA A typical savanna in Kenya • Savanna Figure 50.20
CHAPARRAL An area of chaparral in California • Chaparral Figure 50.20
TEMPERATE GRASSLAND Sheyenne National Grassland in North Dakota Figure 50.20 • Temperate grassland
CONIFEROUS FOREST Rocky Mountain National Park in Colorado • Coniferous forest Figure 50.20
TEMPERATE BROADLEAF FOREST Great Smoky Mountains National Park in North Carolina • Temperate broadleaf forest Figure 50.20
Tundra TUNDRA Figure 50.20 Denali National Park, Alaska, in autumn