Download
1 / 57
570 likes | 719 Vues
iCPSE: Supply Chain Research. Dr Matthew J. Realff (GT) Dr. Nilay Shah (IC) Dr. L. Papageorgiou (UCL). Process industries. Very broad Many companies do not operate at “customer-facing” end of chain Affects supply chain performance significantly. Chemical. Oil/Gas. Pharma/Fine. Energy.

E N D
iCPSE: Supply Chain Research Dr Matthew J. Realff (GT) Dr. Nilay Shah (IC) Dr. L. Papageorgiou (UCL)
Process industries • Very broad • Many companies do not operate at “customer-facing” end of chain • Affects supply chain performance significantly Chemical Oil/Gas Pharma/Fine Energy Metals Enviro Food/FMCG
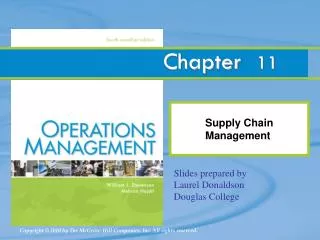
month week day h min s ms ns ps 1 pm 1nm 1 um 1mm 1m 1km iCPSE: Application of “systems” approaches through the chemical supply/value chain Time scale enterprise site plants process units single and multi- phase systems particles, thin films molecule cluster molecules Length scale
Process v discrete • Process industries often compared unfavourably with other (e.g. automobile, computer, aerospace) • Some issues/differences • Different “Bill-of-Materials” • “Inverted”, with co-production and recycles • Open supply chains – intermediates (“sub-assemblies”) may be bought or sold • Many make-or-buy decisions • Order of magnitude more complexity in knowledge of transformation processes required • Asset base age/legacy manufacturing concepts • Manipulation length scale product length scale Process manufacturing aspects significantly affect supply chain performance
BOM: part of petrochemical chain Many tradable intermediates
BOM: Flexible polyols Few RMs, lots of Products
Complexity in operation • Process: need to determine values for many operating variables in manufacturing process • Product properties depend on raw material properties and process operating variables • relationships between raw materials and products may be complex • Many continuous degrees of freedom • People are better at “discrete” decisions • Explains prevalence of optimisation-based methods since 1950s, but … … slows down the rate of innovation
Asset base: is mass customisation possible? • Consider pharmaceuticals as an exemplar • Advances in science (biochemistry, genetics) and medicine mean that customised healthcare is possible in theory • But existing pharmaceutical supply chains are incorrectly configured for this • Consider a particular mental health therapeutic drug
Therapeutic product supply chains • Primary production processes usually “slow” • lowish yield • labour- and time-intensive • can take 30-200 days from end to end • many QA steps along the way • Secondary processing often geographically separate from primary • transportation lags • Slow value chain for new pathogens • Very sequential • Isolate, identify, test, test, test, seek approval, design facility, build facility, operate … • Hence no SARS, Bird Flu vaccine yet …
Secondary manufacturing Coating Granulation Compression QC Blister packing One batch (smallest lot size) = 3 million (identical) tablets
OH CH3 Cl NH2 Manipulation lengthscale v product lengthscale • Making a complex chemical: • Start with a backbone… … and add groups in a sequence Molecular length scale product with O(1m) length scale manipulations
Manifestation in symptoms • Pharmaceuticals and related: poor material efficiencies • Process chemistry, solvent and catalyst choices result in • Low material efficiencies (of order 1% of material entering supply chain ends up as product) Incidentally …. • Sub-optimal design of drug delivery systems results in • Low bio-availability where required (of order 1% for traditional formulations e.g. pills) • 1mg delivered to target area: • may require 10kg of materials overall…
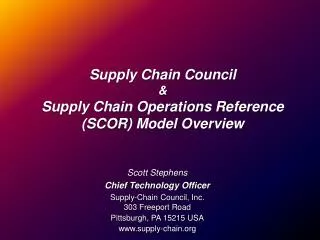
Symptom 1: material inefficiency Effluent 42% Landfill 9% Incineration 6% Material in 100% Manufacture Product 10% Recovery/recycle 29% Solvent ‘loss’ 2% Typical fine chemical batch process single stage mass balance (Source: Britest partners) By-product sold 2%
Symptom 2: low responsiveness • Low manufacturing/supply chain velocities • High stocks • Pipeline stocks typically 30-90% of annual demand in quantity, usually 4-24 weeks’ worth of finished good stocks • Supply chain cycle times can lie between50-300 days • Poor responsiveness to changes in demand • Value-added timesof0.3-5% overall • Molecules are idle for long periods
Statistical data from plant operating records Holding material while waiting for something else “Useful” operations
Pressures faced by the sector • Global competition … • Cost pressures • Desire to enhance service/IP component of products • e.g. reconfigure supply chain to modify “delivery” aspects • Shorter product lifecycles • e.g. “me-too” drugs • Drive towards mass customisation • “Specialty” products at “commodity” prices • Stakeholder pressures • End of life product management • Supply chain sustainability • Environmental regulation
Research & development 15% Primary manufacturing 5 - 10% Secondary mfg/packaging 15 - 20% Marketing/distribution 30 - 35% General administration 5% Profit 20% Total 100% The pharmaceutical value chain: relative costs “There is a welcome move away from viewing the supply chain as merely having to deliver security of supply at minimum cost, to a recognition of its ability to generate value for the customer and the shareholder” (Booth, 1999) (Shott, 2002)
Implications for quick response to (anticipated) release of pathogens • Standard supply chain cannot work if it must start from scratch • Need to devise an appropriate strategy and supporting infrastructure • Activities: • develop potential scenarios • devise a strategy that is robust against these • provide necessary infrastructure • Needs to be “anticipatory” • Need new, more concurrent value-chain engineering approach • Need flexible discovery, screening and manufacturing facilities for faster response (i.e. not designed for particular pathogen)
Capacity planning under clinical trials uncertainty materials entering CT - outcome unknown promising CT results current products • How to: • allocate capacity between products ? • plan capacity investment ? • Extreme cases • pessimistic: no investment and many successful products: severe capacity limitations • optimistic: investment plenty of capacity but no new products • Need for systematic way to balance risks demand successful product life-cycle time
Clinical trials – one product Success High Deterministic stage 0.95 Launch 0.10 High 0.40 Failure Target Success Low 0.05 0.60 0.50 0.9 clinical trials Minimum 0.10 Failure 0.30 Failure 0.1 Phase II (~2 year) Stage 1 Registration (1 year) Phase III 3-5years Stage 2 & 3
Alternative investments for company • Many options considered (e.g.) • Expand existing site(s) • Alternative process technologies • Invest in new tax haven site • Multi-disciplinary approach with input from • Taxation • Production planners/process engineers • Logistics • Marketing and demand management • Model optimises investment and production decisions to maximise expected NPV within risk constraints
NPV Distribution – Example 0.16 0.14 Prob. of loss 30% 0.12 0.1 Probability % 0.08 0.06 0.04 0.02 0 0 100 200 300 600 700 400 500 -200 -100 NPV Break Even Expected/Average NPV =239
NPV Distributions – two options lower risk higher risk
Option chosen Risk analysis Worst Case Exposure m£ NPVs (INCREASING RISK) 30% 0% 15% Probability of a loss
Option chosen Upside analysis Best Case NPVs m£ 70% 100% Probability (breakeven at least)
month week day h min s ms ns ps 1 pm 1nm 1 um 1mm 1m 1km iCPSE: Application of “systems” approaches Pharmaceutical supply/value chain Time scale enterprise site plants process units single and multi- phase systems particles, thin films molecule cluster molecules Length scale
Increase in Manufactured Value Component Manufacturing Material Final Manufacturing Assembly Point Raw Material of Sale Refining Collection Chemical & Material Sorting Recycling Compounding Demanufacturing Decrease in Manufactured Value Forward Logistics Arcs Reverse Logistics Arcs Reverse Production Systems The system for taking back and using products at their end of life.
Overall Methodology Reservoir Estimation Methods Using GIS Superstructure of Logistic Network State Task Representations of Process Systems Robust Optimization Formulations and Solution Methods For Large Scale MILP’s
A FF1 A mix of 5 plastics B SF1 ES1 C SF2 FF2 D ES2 E + - +V Overall Methodology Superstructure based methods for process design under uncertainty Trajectory-based Separation System Modeling & Analysis
“Reservoir Engineering” Business Government Residential Product Retirement (Failure, Obsolescence) Organization Behaviour (Stockpile, Recycle, Dispose) Transportation Costs (Distance,Frequency, Modes)
Reservoir Estimation Methods Using GIS Superstructure of Logistic Network State Task Representations of Process Systems Robust Optimization Formulations and Solution Methods For Large Scale MILP’s
Discrete Variables: Network Structure, where the materials are collected and processed Continuous Variables: Network Flows in each scenario Robust Problem Formulation Robust Measure : Minimize the maximum deviation from optimality or minimized d> Ow* _ Rwfor allw
Research Question? • How to effectively solve the problem with finitely large number of scenarios when scenarios are nicely designed? The design of scenarios is a full factorial design. (Each uncertain parameter independently takes its values from a finite set of discrete real values.) Two uncertain parameters: up1 and up2 up2 12 scenarios Possible value up1 Possible value
MILP1 and MILP2 Models (Relaxation Problem) FFBLPP Model Full Factorial Robust Algorithm What is the best solution for these scenarios? Candidate Robust Solution Is this solution feasible for allw in W? Scenario with max regret possible for the candidate solution and Infeasible Scenario No FFBLLP Model Stop when UB – LB < e Upper Bound (UB) on Min-Max Regret Value Yes Candidate Robust Solution What is the worst scenario for this solution? and Lower Bound (LB) on Min-Max Regret Value
Robust RPS Infrastructure for Television Recycle in GA 12 Municipal collection sites 9 Commercial processing sites (A)
Problem Size with Uncertainty For uncertainty level 3-7, the direct method failed to solve the problem using C++ with CPLEX 9.0 on Pentium (R) 4 CPU 3.6 GHz with 2 GB RAM. (Still running after 8 hours)
Superstructure of unit operations Unit Operations Models Superstructure of Logistic Network Robust Logistics and Process Network
Size reduction density Ferrous Metals Removal Sink-float wettability Froth flotation Non-ferrous Metals Removal charge Electrostatic Plastics Separation spectrum Spectroscopic Post processing A Mechanical Separation Process A mix of products Uncertainties: Feed composition, volume Separation by Different mechanisms Recycled metals, plastics Uncertainties: Product prices, demands
Recovery (%) 100 75 50 25 0 75 50 25 Models from Mineral Processing Experimental approach Theoretical approach C: concentration D: diffusion coefficient v: velocity k: rate constant Does not account for the particle distribution
+ - Unit Modeling-Free-fall electrostatic separation • Distributions: • Particle entering position: • x0~ uniform distribution U(-a, a) • Particle charge-to-mass ratio: • qm ~ normal distribution: N (,) Particle horizontal position at the bottom
The Recovery Model Recovery to the left bin is the probability that particle final position is less than the bin position: where Jing Wei and Matthew J. Realff, 2003, Design and Optimization of free-fall electrostatic separators for plastics recycling, AIChE J., 49(12): 3138-3149
Transformation from the CDF Model to the Partition Curve Model For 50: For Ep: (1) When the entering position is the only random variable (2) When the particle charge-to-mass ratio is the only random variable (3) When both random variables exist, fit the data to the empirical model a=2.8725, b=1.0513, c=2.3784
Unification of Unit Models Partition curve For free-fall electrostatic separation Choose as the charge-to-mass ratio Ep for the case with only the distribution of particle entering position Ep for the case with only the distribution of particle size
Step 1: Trajectory model Do force balance and derive a trajectory model y= f (d, p, ), where d, p and are vectors of design, operating variables and distribution parameters Step 2: Recovery model Find the joint probability expression for recovery R=Pr{ y y*} and do a numerical calculation if an analytical solution is not available • Step 3: Partition curve model • Derive 50 from the deterministic case • Find Ep models for cases where only one random variable exists • Fit the Ep data to the empirical model following a multi-stage approach A Unified Approach Jing Wei and Matthew J. Realff, 2003, A unified probabilistic approach for trajectory based solids separations, AIChE J.
Superstructure based methods for process design under uncertainty A FF1 Recovery (%) Recovery (%) A mix of 5 plastics B SF1 ES1 C 75 50 25 75 50 25 SF2 FF2 D ES2 E - + +V Models to Design Method Mixed Integer Nonlinear Programming Strategy Trajectory-based Separation System Modeling & Analysis