Download
1 / 2
30 likes | 200 Vues
Criterion for Cutoff Size of Bed Material Load Versus Wash Load in Sand Bed Streams. Chris Paola and Gary Parker St. Anthony Falls Laboratory, University of Minnesota Mississippi River at 3 rd Ave., Mpls. MN 55414. Motivation

E N D
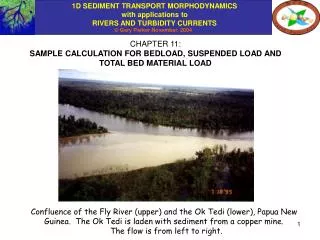
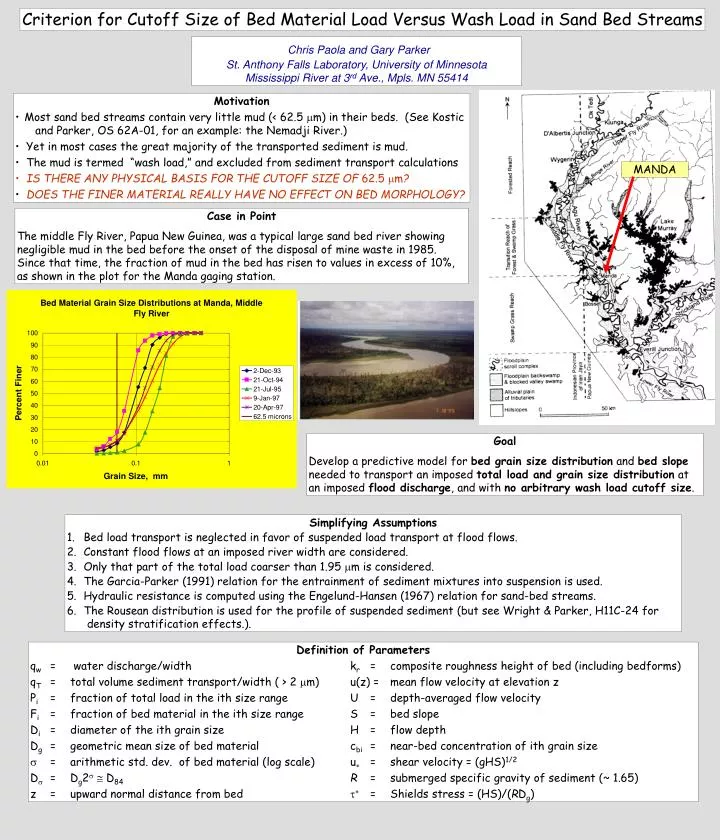
Criterion for Cutoff Size of Bed Material Load Versus Wash Load in Sand Bed Streams Chris Paola and Gary Parker St. Anthony Falls Laboratory, University of Minnesota Mississippi River at 3rd Ave., Mpls. MN 55414 • Motivation • Most sand bed streams contain very little mud (< 62.5 m) in their beds. (See Kostic and Parker, OS 62A-01, for an example: the Nemadji River.) • Yet in most cases the great majority of the transported sediment is mud. • The mud is termed “wash load,” and excluded from sediment transport calculations • IS THERE ANY PHYSICAL BASIS FOR THE CUTOFF SIZE OF 62.5 m? • DOES THE FINER MATERIAL REALLY HAVE NO EFFECT ON BED MORPHOLOGY? MANDA Case in Point The middle Fly River, Papua New Guinea, was a typical large sand bed river showing negligible mud in the bed before the onset of the disposal of mine waste in 1985. Since that time, the fraction of mud in the bed has risen to values in excess of 10%, as shown in the plot for the Manda gaging station. Goal Develop a predictive model for bed grain size distribution and bed slope needed to transport an imposed total load and grain size distribution at an imposed flood discharge, and with no arbitrary wash load cutoff size. • Simplifying Assumptions • Bed load transport is neglected in favor of suspended load transport at flood flows. • Constant flood flows at an imposed river width are considered. • Only that part of the total load coarser than 1.95 m is considered. • The Garcia-Parker (1991) relation for the entrainment of sediment mixtures into suspension is used. • Hydraulic resistance is computed using the Engelund-Hansen (1967) relation for sand-bed streams. • The Rousean distribution is used for the profile of suspended sediment (but see Wright & Parker, H11C-24 for density stratification effects.). • Definition of Parameters • qw = water discharge/width kr = composite roughness height of bed (including bedforms) • qT = total volume sediment transport/width ( > 2 m) u(z) = mean flow velocity at elevation z • Pi = fraction of total load in the ith size range U = depth-averaged flow velocity • Fi = fraction of bed material in the ith size range S = bed slope • Di = diameter of the ith grain size H = flow depth • Dg = geometric mean size of bed material cbi = near-bed concentration of ith grain size • = arithmetic std. dev. of bed material (log scale) u = shear velocity = (gHS)1/2 D = Dg2 D84R = submerged specific gravity of sediment (~ 1.65) z = upward normal distance from bed = Shields stress = (HS)/(RDg)
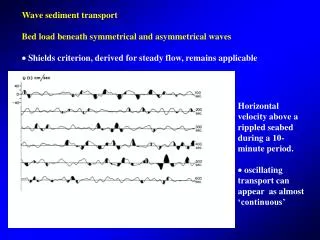
Statement of the Model where vsi denotes the fall velocity of the ith size, denotes the Karman constant and zr denotes a reference elevation. The basic relation is The sediment entrainment formulation of Garcia-Parker (1991) is as follows, where us denotes shear velocity due to skin friction. The parameters kr and us are evaluated from Engelund-Hansen (1967) as Flow velocity is evaluated as • Implementation • Water discharge per unit width qw = UH is held constant at 15 m2/s. For a width of 200 m, this corresponds to the bankfull discharge of the Middle Fly River of 3000 m3/s. • The grain size distribution of the imposed load is held constant at the illustrated distribution, which consists of 8.51% sand and 91.49% mud. • The imposed sediment concentration in the water in mg/liter C = 106x (R+1)qT/(qT+qw) is allowed to vary between 442 to 68806 mg/liter • The resulting grain size distribution of the bed material and equilibrium depth H and slope S are back-calculated from the above formulation. Bed gets muddier as C increases! Note how the fraction of mud in the bed increases and the geometric mean size of the bed material decreases as concentration increases! What is the effect of the mud on channel morphology? In the diagram below equilibrium depth H and slope S are computed for a base case C = 4409 mg/l, but with the load truncated below sizes ranging from 1.95 m to 125 m (and the load concentration adjusted accordingly). The model predicts a WEAK but DISCERNIBLE effect of “wash load” on channel morphology! Is this effect real? We suspect not completely so. If the material below a given truncation size is present in such small quantities in the bed that it can comfortably fit within the pores of the coarser material, it should no longer have a discernible effect on channel morphology. We thus (somewhat arbitrarily) define a CUTOFF SIZE FOR WASHLOAD AS ONE SUCH THAT THE FINER MATERIAL WOULD OCCUPY 5% OF THE PORE SPACE OF THE COARSER MATERIAL. Relation for porosity versus arithmetic standard deviation of bed material (adapted from Beard and Weyl, 1973) OUR RESULT!!! We can define a mechanistically consistent, dynamically varying cutoff size for washload that can fall below 62.5 m if, for example, the imposed load is sufficiently high!