Download
1 / 32
320 likes | 448 Vues
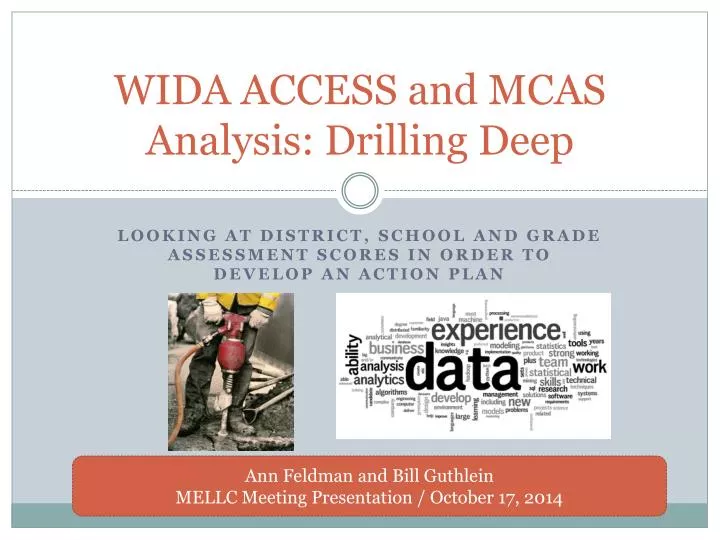
WIDA ACCESS and MCAS Analysis: Drilling Deep. Looking at District, School and Grade Assessment Scores IN ORDER to Develop an Action Plan. Ann Feldman and Bill Guthlein MELLC Meeting Presentation / October 17, 2014. ZOOM! By Istvan Banyai : In Reverse!. Language Objective.

E N D
WIDA ACCESS and MCAS Analysis: Drilling Deep Looking at District, School and Grade Assessment Scores IN ORDER to Develop an Action Plan Ann Feldman and Bill Guthlein MELLC Meeting Presentation / October 17, 2014
Language Objective We will use the following technical vocabulary and expressions indicating analysis when looking at Waltham’s ACCESS and MCAS data. http://www.htsb.org/wp-content/uploads/2014/07/Academic-Language-Functions-toolkit.pdf CPI: Composite Performance Index SGP: Student Growth Percentile ELP: English Language Proficiency Domains These facts suggest that……. Given the evidence, we can deduce that …… This is significant because…….. We can interpret …….as……… After careful examination of... it appears that..
Looking at Waltham Public Schools’ ELL Growth Waltham’s ELL population has grown to include close to 200 more students in October, 2014 versus during the 2013/2014 school year.
Title III Summer Grant With this growing ELL population, it was time to figure out where to target our efforts. Funding was approved for summer work on analyzing data. Bill Guthlein from WJG Associates, data specialist, worked with me to look at ACCESS and MCAS scores. This investigation became the “fuel” for school and district improvement plans.
Student Growth Percentile (SGP) Formulas • Although we did look at English language proficiency (ELP) levels across the district , we decided to concentrate primarily on how students improved vis-à-vistheir English language acquisition from the 2013 to the 2014 ACCESS administration: • 1% to 19% = VERY LOW GROWTH • 20% to 39% = LOW GROWTH • 40% to 59% = MODERATE GROWTH • 60% to 79% = HIGH GROWTH • 80% to 99% = VERY HIGH GROWTH
ACCESS SGP Across Grades • Grade 1, 5, 6 growth was well above state average, on border of High Growth (60+ SGP). • All other grades -except for 9th graders who represent only 9 students – were in Moderate Growth range of 40- 60 SGP. • SGP median for all grades in Waltham PS is 53, better than the statewide median of 50.
English Language Proficiency Domains There is a trend upward through 5th grade; many students exit out of the program after graduating from elementary school and domains are lower. Also, looking at newly-arrived ELLs, there is a large influx in 6th and 9th grades.
Example Analysis of Reading Language Domain Reading: • Kindergartners have the lowest reading proficiency level of all grades. Students are just learning how to read and write in this grade level and perhaps is to be expected 6 months after entering the district. Grade level 1 has a jump to 3.5 and, by the second grade, the average proficiency is at level 4.5. The average reading proficiency levels in grades 2 – 5 is 4.4. • Reading proficiency was the lowest in grades 9 – 12. This domain has the lowest proficiency levels district-wide (other than in Kindergarten) The average reading proficiency level district-wide is 2.9.
MCAS ELA Median SGP by Year for Waltham’s ELLs District Report PE-305 ELL students’ growth in ELA accelerated tremendously (24 percentile points) in 2014 from the prior year. ELA SGP of 60 is considered at the border of high growth. In 2014 Waltham ELLs’ SGP surpassed that of the state’s median SGP for all ELLs and is equal to all Waltham students.
MCAS Math Median SGP by Year for Waltham’s ELLs District Report PE-305 ELL students’ growth in Math has been accelerating from 2012 to 2014. Math SGP of 57 is considered at the border of high growth. For the first time, Waltham ELLs’ median SGP has surpassed that of the state’s median SGP for all ELLs. ELL Math growth climbed +9 (to 57 median SGP) even as growth declined -4 among all students.
District Achievement Distribution by Year ELA District Report PE-305
District Achievement Distribution by Year Math District Report PE-305
Sample of Analysis of ELL MCAS Achievement Levels In the last year the Waltham ELL subgroup improved its achievement level in English Language Arts but Mathematics remained flat as measured by the Composite Performance Index or CPI. A CPI of 100 indicates proficiency (or above). The ELL group's 2014 ELA CPI improved by 5.5 points to 50.2. Notwithstanding the improvement, the district's English Learners are somewhat less proficient than ELL students statewide. There is a significant gap in Math proficiency (13.5 points) between the district's ELL students and the statewide group.
Celebrating our ELLs’Growth at Convocation “This year, for the first time, there is a measure to determine the growth in English skills experienced by our English Language Learner students relative to other Massachusetts students in this subgroup (ACCESS 2013 to 2014). District wide the median growth was 53, above the statewide average. Fifth graders achieved a median growth of 60 which is considered “high growth” performance by state educators. First graders and sixth graders also did well scoring median growth of 59.5 and 59, respectively. Success in learning English is tied to success in the curriculum. This year English Language Learners in the district showed strong growth on MCAS tests scoring a 60 growth percentile in English Language Arts and 57 in Math when measured to the total student population in the state.”
WIDA ACCESS Median SGP by School • Students at two schools - Fitzgerald and Plympton - recorded SGP of just below 40. Statewide average SGP is 50. Attention should be paid on why there is slow growth at these schools compared to others in the district. We will “drill down” to the grade level to try to pinpoint focus areas for improvement.
Sample Analysis of Schools’ SGP by Grade • First grade growth was weak at Fitgerald and Plympton. Both are below the 30th percentile SGP. As these are also grades with the most students, focusing efforts here may have the most impact. • On the other hand first grade growth is strong at Stanley and Whittemore. Northeast had remarkable 93 SGP but there were only six students with reported scores. • Whittemore's relatively large second grade cohort (n=27) reported the lowest second grade SGP of 36 across the district. This looks like another area to focus on. It is important to keep in mind that the greatest percentage of second grade students were in a class with a long term substitute teacher last year. • Stanley had superior SGP consistent throughout the grades. Their model is almost exclusively an inclusive-pull out model as is Northeast’s program. Note that Northeast’s SGP cohort was made up of only 22 students versus Stanley’s which had 62 students.
Student SMART Goal During the 2014-2015 school year, I will work collaboratively with district administrators and teachers to increase the SGP on the WIDA ACCESS test from 40 and 39 at Fitzgerald and Plympton Elementary Schools (reflected on the Spring 2014 ACCESS scores) to 50 or above for each of these schools (as reflected on the Spring 2015 ACCESS scores).
Action Plan Includes: Sharing data with the principals at targeted two schools. Share data with individual teachers. Principals may choose to delve deeper into possible reasons for minimal growth: ELL-SWD, socio-economic levels, staffing considerations, program models, etc. Ongoing observations and follow-up conversations with teachers and administrators. Pre- and post- REACH unit assessments /tracking student progress. Targeted professional development based on observations. Administration of ACCESS and analysis in May 2015. Re-evaluation of program models in schools.
Mystery of Poor Math MCAS Scores at Kennedy Middle School In this Episode Our Hero, Data Detective, Looks at Chronically Low Math Proficiency Among our ELLs
Contact Information Bill Guthlein WJG Associates 978.263.1386 wjgassociates@verizon.net william.guthlein@verizon.net Ann Feldman Waltham Public Schools 781.314.5498 annfeldman@k12.waltham.ma.us