Download
1 / 22
220 likes | 286 Vues
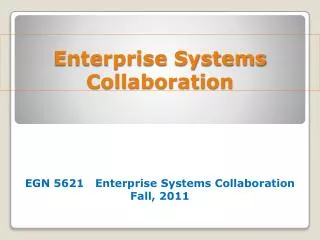
5621 Enterprise System Collaboration Summer B - 2012 Team DD Cristina Bisambra Marketing Manager Marta Gomez Sales Manager Cristina Rodriguez PP Manager Julio Duharte CEO. Strategy.

E N D
5621 Enterprise System Collaboration Summer B - 2012 Team DD Cristina Bisambra Marketing Manager Marta Gomez Sales Manager Cristina Rodriguez PP Manager Julio Duharte CEO
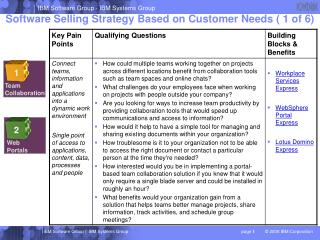
Strategy Our company followed the initial strategy to the point by identifying the most profitable items in round one, investing in marketing on all three quarters focusing on the south region which had the largest quantity of retail stores and hypermarkets. Also, maintaining good inventory with high margins, and releasing production on time to prevent days without stock.
Correlation between Inventory and Profit The correlation between inventory and profit is – 0.740. This means that as inventory increases, the profit decreases, and vice versa.
Correlation between Marketing Expenses and Revenue Correlation between Marketing Expenses and Profit The correlation between marketing expenses and profit is 0.961 and the correlation between marketing expenses and revenue is 0.968. This means that there is a strong positive relationship between both elements. As the cost of marketing expenses increases, so does the revenue in sales and thus profit, and viceversa.
Group EE and FF Strategies The strategies for Companies EE and FF were very similar to ours. High Margins, investment in marketing, maintain inventory, and controlling the releasing of production. The only difference was that these companies maintained their high prices the entire game which lead them to higher profits at the end of the game.