Download
1 / 1
10 likes | 165 Vues
B. B. B. B. B. C. C. C. C. C. B. A. C. pRNS-1-1. RWPE-1. LAPC4. LNCaP. C4-2B. 22R v 1. cds2. miR-124. U6. 1.0. 1.0. 0.3. 0.2. 0.3. 0.1. 0.1. 5. 8. 9. 11. 16. miR-124. U6. 1.0. 0.9. 1.0. 0.3. 1.0. 1.0. 1.0. 0.2. 1.0. 0.1.

E N D
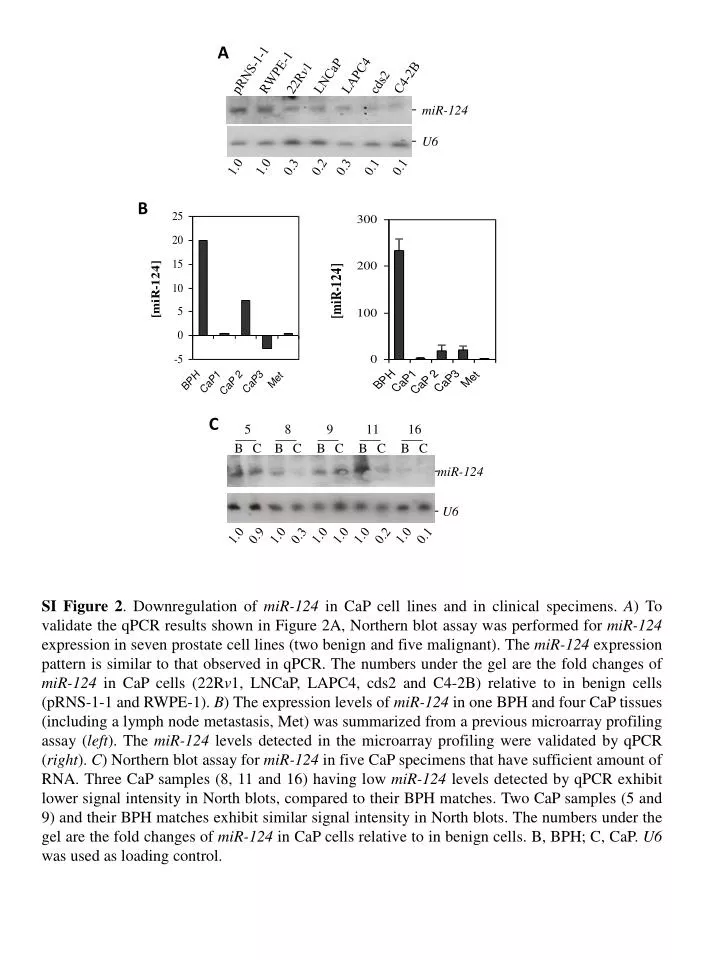
B B B B B C C C C C B A C pRNS-1-1 RWPE-1 LAPC4 LNCaP C4-2B 22Rv1 cds2 miR-124 U6 1.0 1.0 0.3 0.2 0.3 0.1 0.1 5 8 9 11 16 miR-124 U6 1.0 0.9 1.0 0.3 1.0 1.0 1.0 0.2 1.0 0.1 SI Figure 2. Downregulation of miR-124 in CaP cell lines and in clinical specimens. A) To validate the qPCR results shown in Figure 2A, Northern blot assay was performed for miR-124 expression in seven prostate cell lines (two benign and five malignant). The miR-124 expression pattern is similar to that observed in qPCR. The numbers under the gel are the fold changes of miR-124 in CaP cells (22Rv1, LNCaP, LAPC4, cds2 and C4-2B) relative to in benign cells (pRNS-1-1 and RWPE-1). B) The expression levels of miR-124 in one BPH and four CaP tissues (including a lymph node metastasis, Met) was summarized from a previous microarray profiling assay (left). The miR-124 levels detected in the microarray profiling were validated by qPCR (right). C) Northern blot assay for miR-124 in five CaP specimens that have sufficient amount of RNA. Three CaP samples (8, 11 and 16) having low miR-124 levels detected by qPCR exhibit lower signal intensity in North blots, compared to their BPH matches. Two CaP samples (5 and 9) and their BPH matches exhibit similar signal intensity in North blots. The numbers under the gel are the fold changes of miR-124 in CaP cells relative to in benign cells. B, BPH; C, CaP. U6 was used as loading control.