Download
1 / 75
750 likes | 932 Vues
A Multiscale Analysis of the West African Monsoon Chris Thorncroft Department of Atmospheric and Environmental Sciences University at Albany. A Multiscale analysis of the West African Monsoon. (1) Annual Cycle of Rainfall and associated Water Vapour Transport

E N D
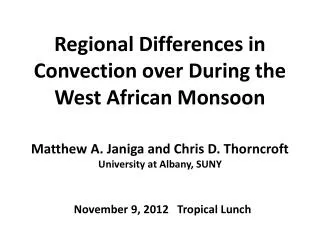
A Multiscale Analysis of the West African Monsoon Chris Thorncroft Department of Atmospheric and Environmental Sciences University at Albany
A Multiscale analysis of the West African Monsoon (1) Annual Cycle of Rainfall and associated Water Vapour Transport (2) Interannual Variability of the coastal rainfall in Spring (3) The African Easterly Wave Life-Cycle: (I) Genesis (II) Baroclinic Developments (III) West Coast Developments (4) Final Comments and Future Work
Annual cycle of Water Vapor Transport in the West African Monsoon region Chris Thorncroft, Hanh Nguyen (University at Albany) Chidong Zhang (RSMAS, Miami) Philippe Peyrille (MeteoFrance, Paris)
The Coupled Monsoon System Key features of the WAM Climate System during Boreal summer Heat Low SAL AEJ ITCZ Cold Tongue
Meridional Circulations North-South Section along the Greenwich Meridian AEJ 50oC 90oC θ θe θe θ 20oC 60oC
Meridional Circulations Shallow Meridional Circulation (SMC) over ocean, especially in Spring AEJ 50oC 90oC θ θe θe θ 20oC 60oC
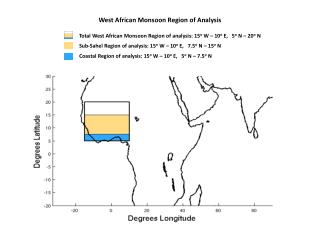
Annual Cycle of Mean Rainband Data: GPCP (Global Precipitation Climatological Project). Resolution: pentad on a 2.5o grid. Averaged from 10oW to 10oE over 23 years (1979-2001). c.f. Gu and Adler (2004)
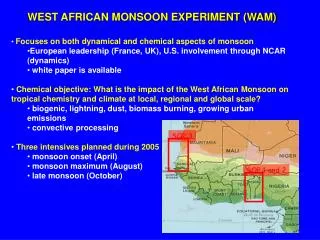
Aims • To document the climatological mean annual evolution of the water vapour transport and associated three-dimensional pattern of moisture convergence in the WAM and tropical Atlantic regions. (revisiting Cadet and Nnoli (1987)) • To relate this to the regional circulations and low-level thermodynamic conditions, especially those linked to the Atlantic cold tongue and Saharan heat low. • To improve understanding of the various phases of the annual cycle of WAM rainfall
Data • Observations, reanalysis and operational analysis data including: • pentad 2.5o GPCP • Reynolds SST 1o, weekly and daily • Reanalysis from the ECMWF: daily 2.5o ERA40 • The period of study is 1979-2001
Relationship between rainfall and surface conditions Relationship between SKT and surface meridional wind SKT and rainfall Warming over the continent due to the surface solar heating. Rapid cooling of the ocean surface south of the equator between April and June rapid rise in MSLP: Acceleration of southerly winds across the equator. c.f. Okumara and Xie (2004) MSLP and VWND
Relationship between rainfall and surface conditions Equivalent potential temperature • Peak rainfall always lies south of thetae peak • Gradient in thetae still important • Location of heat low important for poleward extent
Total Column Moisture Flux Convergence Peak in moisture flux convergence linked to heat low shallow meridional circulation – acts to moisten the column and extend the rainfall polewards (c.f. Sultan and Janicot (2000,2003), Hagos and Cook (2008))
Total Column Moisture Flux Convergence Peak in moisture flux convergence over ocean
Total Column Moisture Flux Convergence Rapid shift and increase in moisture flux convergence towards coast between April and May
Total Column Moisture Flux Convergence Rapid reduction in moisture flux convergence during June – linked to end of coastal rains
Total Column Moisture Flux Convergence Rapid increase in moisture flux convergence beginning of July linked to Sahelian rainfall onset
Meridional Moisture Fluxes Mid-levels (850-500mb) Impact of Heat Low SMC Low-levels (sfc-850mb)
Meridional Moisture Fluxes Mid-levels (850-500mb) Equatorward moisture flux at mid-levels enhances moisture flux convergence in rainy zone : enhances rainfall there? Polewards of this there is dry advection: inhibits rainfall there? Low-levels (sfc-850mb)
Meridional Moisture Fluxes Mid-levels (850-500mb) Low-levels (sfc-850mb) Marked increase in cross-equatorial moisture fluxes during April-May Linked to cold tongue development and coastal onset
Schematic evolution ITCZ 1. Ocean phase (Feb-April): -Main rainband is broad with peak values just poleward of the Equator (~1oN ). The rainfall is located mostly over the warmest water (>28oC) with little over the land. -At the end of this period the cold tongue starts to develop, resulting in a broad region of SSTs close to the equator falling below 28oC. - Does the heat low SMC impact the surface winds? SMC HL SST
Schematic evolution • 2. Coastal phase (May-mid-June): • -Cold tongue development associated with a rise in equatorial surface pressure, and an acceleration of southerlies and associated moisture flux towards the coast. • -Marked moisture flux convergence, just equatorward of the land (~4oN) is associated with the highest rainfall of the annual cycle, and the first rainy season for coastal regions of West Africa. • c.f. Zheng, Eltahir and Emanuel (1999) • Okumara and Xie (2004) • Gu and Adler (2004) • Caniaux et al (2009) • - Peak rainfall is located over warmest water ITCZ SMC HL SST
Schematic evolution • 3. Transitional Phase (End of June) • June represents a period where the environment becomes less favorable for convection in the coastal region. This is consistent with coastal upwelling and a reduction of SSTs there. • Intense coastal rainfall can only be transient? • Why doesn’t it rain more in June? • Does this weakening promote the perception of a “jump” often discussed in the literature? ITCZ SMC HL SST
Schematic evolution 4. Sahelian Phase (July-August): - Between June and July the peak in moisture flux convergence reaches 10oN and increases rapidly consistent with the observed Sahelian rainfall onset. - In July and August moisture flux divergence is present over the coastal region consistent with continued suppression of rainfall there. c.f. Sultan and Janicot (2000.2003) Sijikumar et al (2006) Ramel et al (2006) Hagos and Cook (2007) ITCZ SMC HL SST
ERA40 vs NCEP1 rainfall Wet bias in Spring? Dry bias in Sahel in Summer Dry bias in Spring?
Total Column Moisture Flux Convergence ERA40 NCEP1 can a strong heat low SMC suppress convection south of it?
Concluding remarks on Annual Cycle • At some level the coastal onset seems easier to understand than the Sahelian onset – with peak rainfall following the peak in SSTs • What processes determine the nature and variability of the cold tongue (role of heat low, sub-surface ocean structure, Atlantic ocean variability, radiation)? • Why is cold tongue development more rapid in the Atlantic than in the Pacific? • Can climate models represent these coupled processes? • Need more in situ observations in the tropical East Atlantic! • Need more work on nature and causes of variability of coastal rains (next)
Resolution: pentad on a 2.5o grid. Averaged from 10oW to 10oE over 10 years (1998-2007). TRMM • Similar patterns: • broad and weak in winter. • a rapid shift of the southern limit of the rainband in May. • most intense in spring. • a marked decline in June-July. • rapid shift to the Sahel in summer. • steady retreat following surface solar heating. • Different intensities: • strong in winter for CMAP. • strong in spring for TRMM and CMAP. • weak in summer for CMAP. CMAP GPCP
Resolution: pentad on a 2.5o grid. Averaged from 10oW to 10oE over 10 years (1998-2007). TRMM Definition Coastal Onset defined in terms of the rapid reduction in rainfall over the equatorial region and the associated reduction in the width of the ocean rainfall. CMAP GPCP
Composite diagrams TRMM Period: 1998-2007 tOC = 9 May CMAP tOC = 10 May GPCP tOC = 10 May
Interannual variability Coastal length: 7 pentads range: 11 pentads Sahel onset: 6 July range: 7 pentads Coastal onset: 11 May range: 13 pentads Hypotheses: Delayed cold tongue development delays coastal onset Strong heat low delays coastal onset
Relationship between the coastal onset and the Saharan Heat Low
A comparison of 3 years: 2005-2007 07 07 06 06 05 05
2005 Large variation in the coastal onset. Earliest cold tongue development in Spring 2005 – earliest coastal onset. Strongest HL in Spring 2007 during the oceanic regime possible role in delaying the coastal onset via subsidence 20 11 2006 3 21 2007 29 23
Interannual variability Coastal rainfall intensity : 8.2 mm/d ; range: 9.1 mm/d
Relationship between the coastal rainfall and the SST MAY MARCH APRIL FEBRUARY
Concluding remarks on Interannual Variability • The West African coast is characterized by marked interannual variability in rainfall – both in terms of the onset (of the coastal phase) and amounts. • Onset date is influenced strongly by the timing of the cold tongue development as well as the intensity of the heat low. • Rainfall amounts are correlated with SSTs in the Pacific and SE Atlantic suggesting predictability with several months lead-time. • Onset of the coastal phase is correlated with the Sahelian onset. Sahelian onset tends to occur roughly 2 months after the coastal onset.
Variability of Synoptic Weather Systems TD-filtered OLR (AEW-activity) Peaks in summer We know little about the nature and causes of AEW-variability Kelvin-filtered OLR Peaks in Spring Key synoptic system for pre-coastal phase and possibly the coastal phase
3. African Easterly Waves OLR and 850 hPa Flow Regressed against TD-filtered OLR (scaled -20 W m2) at 10N, 10W for June-September 1979-1993 Day 0 Streamfunction (contours 1 X 10⁵ m2 s-1) Wind (vectors, largest around 2 ms-1) OLR (shading starts at +/- 6 W s-2), negative blue Kiladis, Thorncroft, Hall (2006)
3. African Easterly Waves Objectively diagnosed troughs (solid lines), African Easterly Jet (dashed), with PV (315K) and IR from METEOSAT (courtesy Gareth Berry)
AEW life-cycle phases • Phase I: Genesis (e.g. Thorncroft, Hall and Kiladis, 2008) • Phase II: Baroclinic growth (e.g. Berry and Thorncroft, 2005) • Phase III: Tropical Cyclogenesis (e.g. Hopsch, Thorncroft, Tyle, 2010)
Phase I: Genesis Two Theories for the Genesis of AEWs I: AEWs are generated via a linear mixed barotropic-baroclinic instability mechanism AEJ satisfies the necessary conditions for barotropic and baroclinic instability: Burpee (1972), Albignat and Reed, 1980). Therefore we expect AEWs to arise from small random perturbations consistent with a “survival of the fittest” view. Continues to be the consensus view. 315K PV 925hPa q
Two Theories for the Genesis of AEWs I: AEWs are generated via a linear mixed barotropic-baroclinic instability mechanism (evidence against!) • The AEJ is too short! • The jet is typically 40-50o long. • It can only support two waves at one time. • It is therefore not possible for AEWs to develop via a linear instability mechanism. • The AEJ is only marginally unstable! • Hall et al (2006) showed that in the presence of realistic boundary- layer damping the AEW growth rates are very small or zero. • It is therefore not possible for AEWs to develop sufficiently fast to be important.
Two Theories for the Genesis of AEWs I: AEWs are generated via a linear mixed barotropic-baroclinic instability mechanism (evidence against!) • The AEJ is too short! • The jet is typically 40-50o long. • It can only support two waves at one time. • It is therefore not possible for AEWs to develop via a linear instability mechanism. • The AEJ is only marginally unstable! • Hall et al (2006) showed that in the presence of realistic boundary-layer damping the AEW growth rates are very small. • It is therefore not possible for AEWs to develop sufficiently fast to be important. • So what can account for the existence of AEWs, their genesis and intermittancy?
Two Theories for the Genesis of AEWs II: AEWs are generated by finite amplitude forcing upstream of the region of observed AEW growth. Carlson (1969) suggested the importance of convection and upstream topography for the initiation of AEWs. Others pushed the linear instability hypothesis. More recent observational evidence has been provided by: Berry and Thorncroft (2005): case study of an intense AEW Kiladis et al (2006): composite analysis Mekonnen et al (2006): climatological view c.f. Farrel, B. (1987)
Satellite imagery • METEOSAT-7 Water Vapour channel. • Shown every 6 hours from 30th July 2000 00z to 4th August 2000 18z. • Convective outbursts in the first day of the sequence preceded the dynamical signal.