Download
1 / 36
360 likes | 516 Vues
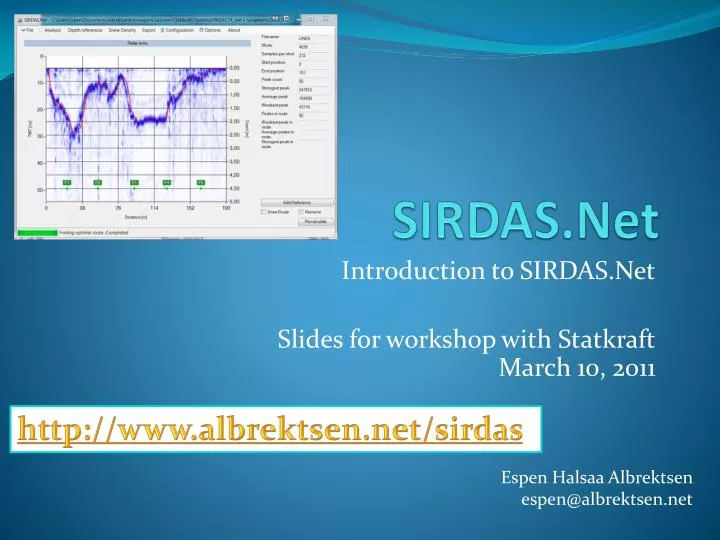
SIRDAS.Net. Introduction to SIRDAS.Net Slides for workshop with Statkraft March 10, 2011. http://www.albrektsen.net/sirdas. Espen Halsaa Albrektsen espen@albrektsen.net. Agenda. Getting started Installation What is SIRDAS.Net Basic operation Opening a file

E N D
SIRDAS.Net Introduction to SIRDAS.Net Slides for workshop with StatkraftMarch 10, 2011 http://www.albrektsen.net/sirdas Espen Halsaa Albrektsenespen@albrektsen.net
Agenda • Gettingstarted • Installation • What is SIRDAS.Net • Basic operation • Opening a file • Depth Reference measurements • SnowDensitymeasurements • Data export • Advanced operation • Manual routecorrection • Data analysis tuning • Vertical filters • Horizontal filters • Routefinder
Gettingstarted • Download and installSIRDAS.Net from • http://www.albrektsen.net/sirdas • Youneedsome Microsoft tools – thesearedownloadedautomatically if not allreadyinstalled on your system • Start theapplication, and request a license key • A request is posted to my web site – I manuallygenerate a license key and email back to you.(Expect 1-3 bussinessdaysdelay) • Start theapplication, and register thelicense key • Start theapplication – youaregood to go!
Basic Operation • SIRDAS.Net supports theNogginPlus file format • Eachscanconsistsof 3 files, with file types ‘.dt1’, ‘.hd’ and ‘.gps’. Thesethree files must be in the same directory and have the same filename: • When a .dt1 file is selected for analysis, SIRDAS.Netimmediately starts processingthe file data. • If theNogginPlus file containsreference points (Fiducial Markers in theNogginPlus manual). SIRDAS.Netassumesthat a NogginPlusFiducial Marker is a manual depthmeasurement, and allowstheuser to enterthisinformation.
Plot navigation • Mouse wheel is supported • Ctrl+wheel zooms in and out • Wheel pans left and right (Afteryou have zoomed) • Zoom out • Press ESC key • By usingthemousewheel • By pressing the zoom outbutton: • Zoom in • By selecting a range • Pan • By mouse or keyboard. • Ctrl-arrowmoves to start or end
Depth References Used to calibratewavepropagationvelocity, and to toadjust for equipment-specificdepth offset
Purpose • Used to calibratetheconversionbetween sample index and depth. • Averagewavevelocitydefaults to 0.2m/ns • The radar signal is sampled at a fixedinterval (samplerate) – a sampleindex is therefore a representationofthetwo-way travel time from radar to ground and back • The wavevelocityvarieswithsnowdensity and needs to be calibrated • Zero-level • Zero-level is initialized to thevaluecalculated by theCut-off-filter. (See filter section for details) • The zero-level offset depends on equipment and alsoneeds to be calibrated. • Zero-levelcan be updatedmanually, or reference points for zero levelcan be entered.
Depth Reference Form RouteSampleIndex is updatedonce a aroute is found ShotIndex is thepositionofthis Depth reference WaveVelocity for thisshot Averagewavevelocity Depth is manuallyentered by theuser Sample index for zero depth
Depth Reference Form Reference point is plotted at «correct» depth and position Zero-level offset clearly visible in graph
Zero-levelindex • Initialized by analyzingtheaverage energy in the first 100 samples of all shots: • Manual overrideeither • By entering a depthreferenceof zero meters • Or by adjusting zero sample indexdirectly
SnowDensityObservations Used to calibratetheformula for convertingsnowdepth to snow-water equivalent (SWE)
SnowDensityMeasurements • Is used to calculatethesnow-water –equivalent (SWE) • Sincesnowdensity is a functionofseveralfactors, manyobservationscan be used to increasedensitypredictionaccuracy • The densityequation is whereb is the Global SnowDensity gradient
Localvs Global SnowDensity LocalDensity Global Density • Used to calculatetheaveragedensity for thisscan • Can be automaticallyselected if position data is registered in thesnowdensity form • Used to calculatethe global density gradient • Linear regression is performed to calculateb • Outlierscan be automaticallydiscarded
SnowDensityForScanForm Equipment used to takemeasure Automatic outlierremoval Measureddensity UTM positionofthisobservation Depth measured StdErrorofselectedmeasures Gross weightmeasured R2ofselectedmeasures Excludethisobservation by removingcheck mark Visualization Global Densityequation
SnowDensityForScanForm Automatic selection (Requiresposition data) Selected for localsnowdensity Distance from thisobservation to thisscan Resultinglocalsnowdensity Localsnowdensityequation Global snowdensity gradient, b
Data Export Saving data…
ExportGroundProfile • Whenthe «Export» menu is selected, a report preview is created:
Export formats • MS-Word • Excel • PDF • Canalso be printeddirectly
Report contents • Header contains • Averagedepth for thescan • Average SWE for thescan. • Signal Velocity used • SnowDensity Equation
Report contents • Report footercontains • Depth References • SnowDensities • Filter configuration
Saving data • The analysiscanalso be saved to a .SIRDAS file • Contains all raw data used to generatetheroute • Containstheimagegenerated by theraw data (as a picture) • .SIRDAS files can be used • To quicklyreviewhistoric data • To update SWE report data by modifying Depth Reference information or SnowDensityMeasures • In order to save disk space, SIRDAS files can not be used to • Edit routeinformation • Edit analysisconfiguration
Advanced features Manual routecorrection Analysis configuration
Manual Routeoverride • Sometimesthe SIRDAS analysis is unable to make a correctpaththroughthe data points. • Checkthe«Draw Route» • Useright mouse toadd manual points • Recalculateroute to checkeffect
SIRDAS Configuration Filters, PeakDetectors and RouteFinders
Filter configuration • Horizontal filters • CutOffFilter – Removeslarge signal from first snowecho • DepthFilter – Compensates for attenuation in snow • LowPassAndMagnitudeFilter – Removeshigh-frequencyoscillations, and converts sample value to amplitude
Configuration form • User interface for changingconfiguration • Shows previewof original data and filtered data Choose filter order and type Configureselected filter Preview filter effect Whichshot to preview
CutOffFilter • Removesthelarge signal from thesnowsurface • Averages first n samples in all shots • Looks for first sample whereaverage is belowtreshold:
Depth filter • Compensates for the signal attenuation in snow: b=0: b=0.1:
LowPassAndMagnitudeFilter • SmoothingFactor=0: • SmoothingFactor=1.3
Horizontal filters • Combinesshotsthatare «close» – requires GPS information to be present in radar data.
Peak detector • Detectspeaks in thefiltered data – not really used anymore. (Version 3.0 used peaks, 3.1 has an improvedroutefinderalgorithm).
Routefinders • This is thecorealgorithm in SIRDAS.Net • Version 3.1 introducedthe«Advanced CheapestCostRouteFinder» • Uses DIJKSTRA algorithmto calculatethe «cheapest» paththroughthe radar data. • Relies on a tunablecostfunction – thisfunction makes it «expensive» for theroute to make large jumps, and makes it «cheap» og throughstrong data points • The parameters can be tuned – see tooltip for explanation. • The otherroutefindersare less accurate, butare faster. Theyshould be avoided, and arekept in theproductprimarily for historicreasons.
Options Display options
Options • Zoom Y-axis: Checkthis in order to zoom on the Y axis • Show Raw Data: Show the data withoutthehorizontalpositionfilter applied • Absolute sample coloring:Whenselected, thecolor showing theechostrength is scaledglobally – defaultvalue is thateachshot is scaled to maximizevisibility.The relative sample coloring makes weak signals lookstrong – useabsolutecoloringwhenyoususpectthis…
Plot navigation • Mouse wheel is supported • Ctrl+wheel zooms in and out • Wheel pans left and right (Afteryou have zoomed) • Zoom out • By usingthemousewheel • By pressing the zoom outbutton: • Zoom in • By selecting a range • Pan • By mouse or keyboard. • Ctrl-arrowmoves to start or end