1 / 15

T-Phi Diagrams

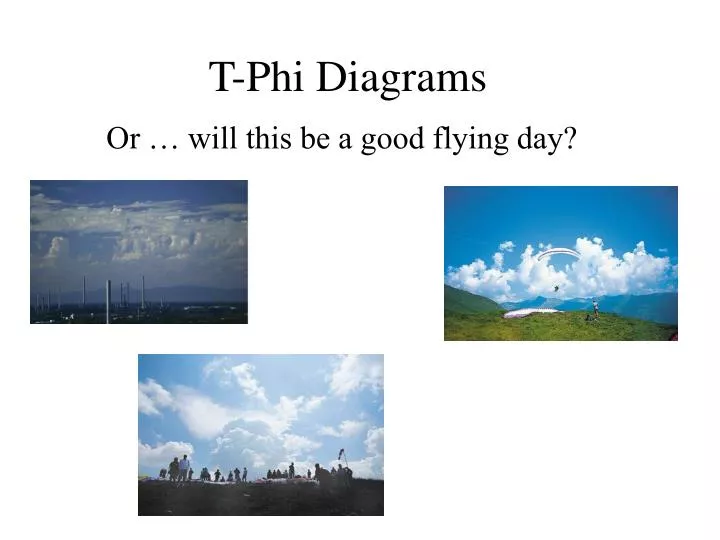
T-Phi Diagrams. Or … will this be a good flying day?. Balloon Soundings. Weather Balloon goes up and measures Temperature and Dew Point = humidity Data goes onto website http://weather.uwyo.edu/upperair/sounding.html For Gauteng use FAIR , which is Irene.

lexi
Télécharger la présentation

T-Phi Diagrams

An Image/Link below is provided (as is) to download presentation Download Policy: Content on the Website is provided to you AS IS for your information and personal use and may not be sold / licensed / shared on other websites without getting consent from its author. Content is provided to you AS IS for your information and personal use only. Download presentation by click this link. While downloading, if for some reason you are not able to download a presentation, the publisher may have deleted the file from their server. During download, if you can't get a presentation, the file might be deleted by the publisher.

E N D

Presentation Transcript


  1. T-Phi Diagrams Or … will this be a good flying day?

  2. Balloon Soundings Weather Balloon goes up and measures Temperature and Dew Point = humidity Data goes onto website http://weather.uwyo.edu/upperair/sounding.html For Gauteng use FAIR , which is Irene

  3. 100 km day in Stueve Diagram

  4. 100 km day in Skew-T Diagram

  5. 70 km from Rustenburg

  6. 60 and100 km from Dunnottar

  7. 170, 100, 70 km from The Dam

  8. Lousy thunderstorm day

  9. Rock’n Roll at The Dam

  10. Real bad day

  11. Poor Winter Day

  12. Good Winter Day

  13. In a nutshell or = BAD = GOOD

  14. Still too complex? Use SOARCAST http://home.att.net/~doug.kathy/Soarcast/Download.htm

  15. Finished More at http://www.sahpa.co.za/sahpa/programs/skygod/

More Related