Download
1 / 29
290 likes | 371 Vues
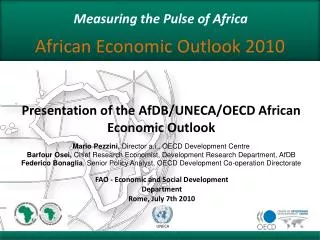
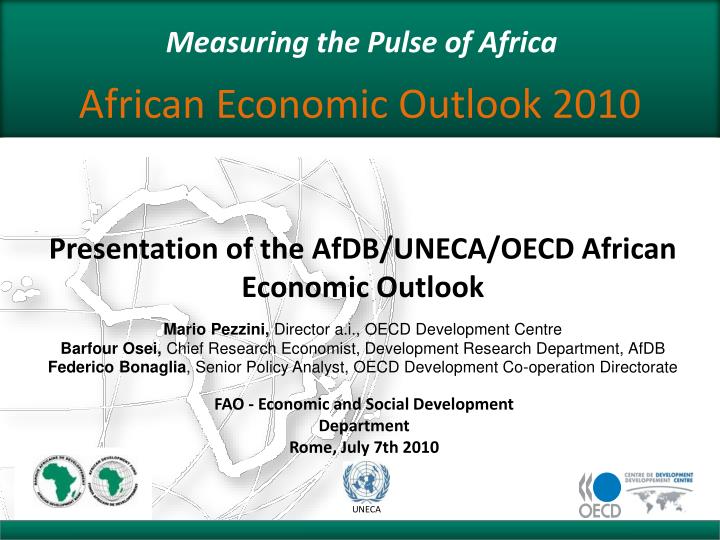
UNECA. 23 April 2009. African Economic Outlook 2010. Presentation of the AfDB /UNECA/OECD African Economic Outlook. Measuring the Pulse of Africa. Mario Pezzini , Director a.i ., OECD Development Centre Barfour Osei , Chief Research Economist, Development Research Department, AfDB

E N D
UNECA 23 April 2009 African Economic Outlook 2010 Presentation of the AfDB/UNECA/OECD African Economic Outlook Measuring the Pulse of Africa Mario Pezzini, Director a.i., OECD Development Centre BarfourOsei, Chief Research Economist, Development Research Department, AfDB Federico Bonaglia, Senior Policy Analyst, OECD Development Co-operation Directorate FAO - Economic and Social Development Department Rome, July 7th 2010
Overview 1 The AfBD/UNECA/OECD African Outlook 2 Highlights on the Macro-Economic Outlook 3 Implications for long-term growth
AEO Partners UNECA Lead partner (since 2007/08) Other partners 10 Independent African Think Tanks Experts Network Financial partners (European Development Fund)
Increased coverage and relevance for the continent • Coverage • from 47 to 50 countries • (+ Comoros, Guinea-Bissau and Sao Tomé & Principe) • Relevance • 99.5% of Africa’s GDP • 97.3% of its population
Focusing on key structural issues every year • Special annual focus • 2003: Privatisation • 2004: Energy • 2005: SMEs • 2006: Transport • 2007: Water and sanitation • 2008: Technical & vocational skills development • 2009: Innovation and ICT • 2010: Public Resource Mobilisation and Aid
Highlights on the Macro-Economic Outlook 1 Macroeconomic Outlook 2 Drivers of Growth 3 The Global Crisis and Africa’s Resilience
2002-2008 Growth was sustained and accelerating... Evolution of Real GDP and Real GDP per capita in Africa 1995-2010 Annualised average of RGDP per capita in USD - 2000- 2008 RGDP growth in Africa 1995-2008 % change = 5.0% ≦ GDP pc (PPP) < 17.9% = 2.5% ≦ GDP pc (PPP) <5.0% = 0% ≦ GDP pc (PPP) < 2.5% = -3.7% < GDP pc (PPP) < 0% Source : AEO 2010
PART 1: MACROECONOMIC OUTLOOK The outlook is generally positive... + 4.5% in 2010 + 5.2% in 2011
PART 1: MACROECONOMIC OUTLOOK Differentiated performance across the continent Real GDP Growth
PART 1: MACROECONOMIC OUTLOOK Projected 10 fastest growing countries in 2010
PART 1: MACROECONOMIC OUTLOOK Projected 10 slowest growing countries in 2010
SECTION 2: DRIVERS OF GROWTH The drivers of growth still largely trade related... Improving commodity prices and volumes Oil and gold Growth rates Copper and aluminium Rice, wheat and maize
SECTION 2: DRIVERS OF GROWTH Private financial flows are to rebound… FDI flows to Africa 2000-2009
SECTION 3: THE GLOBAL CRISIS AND AFRICA’S RESILIENCE In 2009, the crisis slashed economic growth … Real GDP Growth … however, the continent continued growing and the impact was unequal across regions
SECTION 3: THE GLOBAL CRISIS AND AFRICA’S RESILIENCE Whereas some countries saw negative growth… 11 countries experienced declines in GDP per capita of 2% or more in 2009
SECTION 3: THE GLOBAL CRISIS AND AFRICA’S RESILIENCE … many others have proved resilient Several countries saw GDP per capita increase between 3% and 7% in 2009
SECTION 3: THE GLOBAL CRISIS AND AFRICA’S RESILIENCE Economic policies key to resilience % of GDP % Current Account Balance Fiscal Balance Macro balances deteriorated in 2009, but are expected to improve in the mid-term
SECTION 3: THE GLOBAL CRISIS AND AFRICA’S RESILIENCE Supportive aid flows ODA (not declined)
SECTION 3: THE GLOBAL CRISIS AND AFRICA’S RESILIENCE Dynamic emerging partners have also supported growth and assisted with the recovery ODA (not declined) Real GDP growth in Africa and emerging countries
While emerging partners dynamism helped to support growth and to trigger recovery SECTION 3: THE GLOBAL CRISIS AND AFRICA’S RESILIENCE China’s role stands out
Implications for long term growth 1 Challenges and risks ahead 2 Public Resource Mobilisation
CHALLENGES AND RISKS AHEAD Key risks Annual Food Price Indices (2002-04=100) • Global economy not recovering as expected • Exit strategies might be politically difficult and harm fundamentals • Expectations of food prices rising again new social tensions? • Commodity driven growth might bring further specialisation and growth volatility AEO Diversification Index
CHALLENGES AND RISKS AHEAD Beyond crisis recovery Address the structural problems that existed before the global crisis and constrain the potential of sustained endogenous growth, in particular: • Further improving political and economic governance • Improving infrastructure • Reducing barriers for intra-African trade • Combating inequalities and poverty … including through improved domestic resource mobilisation
PUBLIC RESOURCE MOBILISATION Mobilising Africa’s public resources: can and must be achieved Average Median Source: Development Centre, based on AEO country survey’s, 2010.
PUBLIC RESOURCE MOBILISATION Encouraging trends considering income levels ≈ USD 3000 ≈ USD 500 ≈ USD 70 2007 2007 Source: Development Centre, based on AEO country survey’s, 2010.
PUBLIC RESOURCE MOBILISATION But driven by volatile and unbalanced sources of income Tax share = 36.4% of GDP Taxes on income and profits = 11.6% of GDP VAT = 10.5% of GDP Residual taxes = 14.3% of GDP Compared to Germany: Source: Development Centre, based on AEO country survey’s, 2010.
PUBLIC RESOURCE MOBILISATION Four Challenges for African Tax Policy Makers 1. Inadequate capacity Small staff, low pay, IT, governance … 2. Low to very low fiscal legitimacy Health, infrastructure, education … 3. Shallow tax base Informal sector = about 75% 4. Unbalanced tax mix Some overtaxed, some undertaxed Source: Centre de Développement, sur la base des notes pays des Perspectives économiques en Afrique, 2010.
PUBLIC RESOURCE MOBILISATION At national level • In the short run • Tax big informal and formal transactions better • Fight fraud and fiscal evasion • In the medium / long run • Stimulate private sector development • Moderate, broad-based effective tax rates • Strengthen administrative capacity • Build fiscal legitimacy by improving quality of expenditure
UNECA Thank you www.AfricanEconomicOutlook.org