Download
1 / 21
210 likes | 339 Vues
Farming and Living in Rural Ireland: evidence from the 1990s and implications for the future. Caroline Crowley. Presentation Outline. National trends in Irish farming Spatial trends in Irish farming Evolving CAP - shift towards funding for rural development measures

E N D
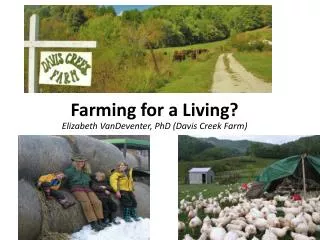
Farming and Living in Rural Ireland: evidence from the 1990s and implications for the future Caroline Crowley
Presentation Outline • National trends in Irish farming • Spatial trends in Irish farming • Evolving CAP - shift towards funding for rural development measures • Issues raised in Farmer Surveys commissioned by Rural Development Groups • Implications and conclusions
National Farm Trends • Between 1991-2000 (Census of Agriculture) • Active farms 17% (to 142,000) • Sole occupation farmers 24% (79,000) • Farmers with another job 37% ( 63,000) • Growing importance of the non-farm economy to maintaining farms
Income source 1987 (%) 1994 (%) 2000 (%) Wages/salaries (off-farm) 29 35 48 Farming 59 58 44 Other (e.g., pensions, investments) 12 7 8 Source: Commins (2003) Importance of Off-farm IncomeComponents of direct income – farm households
Teagasc Walsh Fellow Research • Data from Census of Agriculture and DAF • 130 detailed maps of farm structure, farming systems and rural development schemes • Spatial variation underpinned by • diverse land resources • uneven income opportunities in the non-farm economy • uneven land development pressures • evolving agricultural policies (changing farm income support structures)
Farm Income Support Structure • CAP • Pillar 1 (market supports and SFP) • Pillar 2 (sustainable development of rural areas) • CAP funding structure is changing – shift from Pillar 1 to Pillar 2
Average Farm Business Scale 2000 • Darker green = larger av. farm businesses • S & E - Dairying and Tillage
Farm Income Support related to Public Goods Delivery(CAP Pillar 2)
CAs 2000 REPS 2003
Change in % farmers with other job 1991-2000 • Pinks and reds = increases • Increasing orientation towards the non-farm economy state-wide
Summary of Farm Income Support Indicators • Farm income supports from: • CAP Pillar 1 – greater in the S & E • CAP Pillar 2 – greater in the N & W • Non-farm Economy – increasing statewide • In light of increasing orientation by farmers towards the broader economy, focus on CAP Pillar 2 measures for rural development
CAP Pillar 2 Close-up €1,711 million €6,028 million €461 million
Implications 1 • DAF AgriVision Action Plan retains a commercial farming focus to increase competitiveness, innovation and market orientation • Axis 1 (21% of Pillar 2 funds, 2007-13) • Ex Ante Evaluation of RDP by AFCon Management Consultants/Jim Dorgan Associates describe it as “primarily a plan to address environmental priorities” (2006: vi) based on the planned expenditure • Axis 2 (73.5% of Pillar 2 funds, 2007-13)
Implications 2 • “Regardless of some very positive aspects of farming life, people of enterprise will tend to pursue non-farming alternatives, where initiative and ability are rewarded pro rata” (UCD Department of Agri-business Extension and Rural Development and Rural Dublin LEADER, 1999) • Evidence from 1990s of increasing orientation towards non-farm economy among farmers and other members of farm households • Underpinned by rising third-level education rates and greater living standard expectations
Implications 3 • Farmer surveys from LEADER groups show young people still interested in farming provided: • Access to off-farm jobs (Axis 3 and Regional Development via National Spatial Strategy) • Availability of necessary services such as childcare, eldercare, and public transport (Social Inclusion and Transport Programmes) • Farmer surveys indicate well-educated successors more interested in diversified farm enterprises (Axis 3 and Regional Development via National Spatial Strategy) • Axis 3 only attracts 5.5% of Pillar 2 funds, 2007-2013
Conclusions • Evidence shows important role for development of broader rural economy in sustaining farm households and encouraging farm succession • Challenges (Rural Foresight, 2006) • attracts small proportion of CAP funding • rural development falls under remit of wide range of government departments • research required to fill gaps in knowledge
Thank you caroline.m.crowley@nuim.ie