Download
1 / 42
420 likes | 426 Vues
Neutron detection efficiency of the KLOE calorimeter B.Sciascia (LNF INFN) for the KLONE Group XXXIII LNF Scientific Committee Open session 27 November 2006. Outline.

E N D
Neutron detection efficiency of the KLOE calorimeter B.Sciascia (LNFINFN) for the KLONE Group XXXIII LNF Scientific Committee Open session 27 November 2006
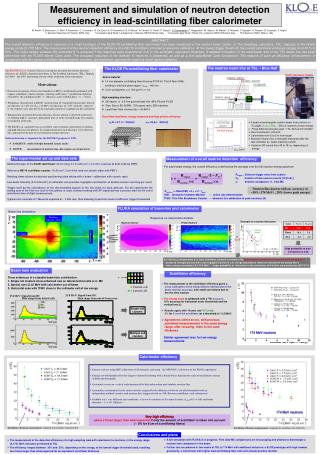
Outline • The KLONE (KLOe Neutron Efficiency) group measured the neutron detection efficiency of a KLOE calorimeter prototype, at The Svedberg Laboratory (TSL), Uppsala. • Reasons behind the formation of the KLONE group. • Characteristic of the neutron source at TSL. • Experimental setup. • Measurements: Method • Neutron detection efficiency for a 5 cm thick scintillator. • Calorimeter neutron detection efficiency, preliminary results. • Neutron energy spectrum from Time of Flight, preliminary results. • Monte Carlo: Some comparisons between data and “fast” Monte Carlo. • Detailed beam line and calorimeter simulation. • Physical processes behind the test beam results.
The reasons behind KLONE • Preliminary measurement with KLOE data and MC (neutron are produced by K interactions with the beam pipe and inner DC walls) showed an efficiency of 40%, larger than the expected 10% if only the amount of scintillator is taken into account. (B. Sciascia, www.lnf.infn.it/kloe/kloe2/memoneueff.pdf) • Thumb rule: efficiency scales with scintillator thickness (1%/cm). • Several works in literature mention an enhancement of neutron detection efficiency for fast neutron in presence of high Z materials, particularly lead • (e.g. see M.Pelliccioni et al., NIMA 297 (1990) 250-257). • KLOE calorimeter has very good time resolution, good energy resolution, and high efficiency for photons. With high neutron detection efficiency, could be also the first of a new kind of neutron detectors. • High neutron detection efficiency is relevant for the future experiments at LNF: • AMADEUS: study of deeply bound kaonic nuclei. • DANTE: measurement of nucleon timelike form factors.
KLONE group • Funding: Use as much as possible already existing material. • Got some INFN funds: CSN5, DR LNF, KLOE, AMADEUS. • Got CEE funds via TARI projects. • A lot of help for: Mechanic: G.Bisogni, U.Martini et al. • Electronics: A.Balla et al. • Detector support: M.Anelli, A.DiVirgilio et al. • Transports: M.Rossi, P.Caponera. • Interesting and useful interactions with TSL group.
Neutron source (TSL) • Neutron beam from 178.8 MeV protons on 7Li target. • 42% of neutrons at max energy. • Calorimeter at 5 m from target. • Absolute neutron flux in the peak measured after the last collimator by 3 beam intensity monitor: better accuracy 10%. EKIN (MeV)
Experimental setup and data set 1. Old KLOE calorimeter prototype, 3×5 cells (4.2×4.2cm2), 60 cm long, read out at both ends by Hamamatsu/Burle PMTs. 2. Beam position monitor: array of 7 scintillating counters, 1 cm thick. 3. Reference counter: NE110, 5 cm thick, 10×20 cm2. A rotating frame allows for vertical (data taking with n beam) and horizontal (for calibration with cosmic rays) positions. (3) (2) (1) • 3 large data sets collected with different beam intensity: • low (1.5 kHz/cm2), medium (3.0 kHz/cm2), and high (6.0 kHz/cm2) • For each configuration, several trigger threshold scans. • Typical run: 0.5-1.5 Mevents, 1.7 kHz DAQ rate. • Cosmic rays run (beam off) for calibrations with MIPs.
Method of measurement Global (no energy dependency) efficiency measurement: fLIVE RTRIGGER e = RNEUTRON× fLIVE× a • RNEUTRON: From beam monitor via neutron flux intensity measured by TSL. • RTRIGGER: use coincidence between sides. • Scintillator: T1 = Side 1×Side 2. • Calorimeter: use the analog sum of 12 PMs/side (first four planes); sum are first discriminated and formed: T1 = SA×SB • fLIVE: live time fraction • a: for preliminary measurement, assume full acceptance and no background. Thr (mV)
Scintillator efficiency - 1 Good check of the measurement method, even if the live time fraction is high in almost all acquired runs. Calibration of the energy scale with a 90Sr b source. 10% accuracy for both vertical (e) and horizontal (Threshold) scales. (%) Thr (MeV e equiv. energy)
Scintillator efficiency - 2 The comparison with previous published measurements in the same energy range, by scaling them to our thickness, is good within the errors. Agrees with thumb rule (1%/cm): 5% for 5 cm thick scintillator (with a threshold of 2.5 MeV electron equivalent energy) (%) Thr (MeV e equiv. energy)
Calorimeter efficiency - 1 • Energy scale set using the conversion factor from KLOE. • 10% uncertainty on both horizontal and vertical scales. • Stability wrt very different run conditions: a factor 4 variations of both live time fraction (e.g. fLIVE=0.2 0.8) and beam intensity (1.5 6.0 kHz/cm2). • Small efficiency decrease with high beam intensity; possible pile-up effects, have to be studied. e(%) Thr (MeV e equiv. energy)
Calorimeter efficiency - 2 • Very high efficiency, about 4 times larger than the expected if only the amount of scintillator is taken into account: 8% for 8 cm of scintillating fibers. • Compare with our scintillator efficiency measurement, scaled by the scintillator ratio factor 8/5 e(%) Thr (MeV e equiv. energy)
Neutron spectrum from ToF - 1 a) b) c) • For the 3 cells of first calorimeter plane: • Correct raw spectra (a) for T0 (b) and convert into ns (c) • TDC spectra of single cell show a 41 ns time structure (from phase locking). • Has to be corrected for wrong clock association (d). • At 5 m from target, rephasing needed for n kinetic energies less than 50 MeV. d) n
Neutron spectrum from ToF - 2 e) f) EKIN (MeV) • From ToF spectrum obtain velocity spectrum (e). • Assuming neutron mass determine kinetic energy spectrum (f). • Compare with the input theoretical n spectrum. • The “per cell” exercise has to be repeated for the whole calorimeter after the cluster procedure definition.
Data – fast MC comparison e(EKIN) For the central cell of the first plane, compare data with fast MC. Assume a n efficiency as function of the kinetic energy. Data-MC comparison of time, velocity, and kinetic energy distributions (dots are Data, line is MC). Other shapes of the efficiency curve have been tested, obtaining a worse agreement between Data and Mc. EKIN (MeV) ns b EKIN (MeV)
MC: detailed simulation Shielding (concrete and steel) Calorimeter 7Li Target • Using Fluka code, simulate a detailed description of the main elements of the beam line (source, collimator, shielding,…) and of the calorimeter: • KLOE simulation: lead-scintillator layers. • New simulation, using lattice tool, design the fiber-lead structure.
MC: physical processes From the simulation of a sample of 1000 monoenergetic (180 MeV) neutrons: 10% elastic processes within the scintillator: could produce the “expected” efficiency. 31% inelastic processes within lead: produce the “unexpected” efficiency rise. The energy is deposited by photons and protons. Also low energy neutrons contribute because of the rise of n-p cross section for low energy neutrons. In average, 5.4 secondary particles per primary n are generated in inelastic interactions, counting only neutrons above 19.6 MeV. The interactions of low energy (En<19.6 MeV) secondary neutrons produce, in average, 97.7 secondary particles per primary neutron.
Conclusions and future plans • The preliminary measurement of the neutron detection efficiency of the KLOE calorimeter, done using KLOE data, has been confirmed by the test beam at TSL. • The preliminary results show an efficiency 4-5 times larger than the expected if only the amount of scintillator is taken into account. • For comparison the efficiency of the 5 cm thick NE110 scintillator has been measured, and turns out to be about 5% as expected. • The results are in agreement with recent simulations based on Fluka. Complete simulations of the calorimeter and the beam line will allow to better understand the efficiency increase. • Apparently the inelastic interactions of the neutrons on lead produce a large amount of secondary particles. The high sampling frequency of the calorimeter allows the detection of such particles. • We plan to complete the analysis of TSL data in the next months. • A new test beam is foreseen (summer 2007) at Louvain (Belgium) to extend the investigation to lower kinetic energies (down to 10 MeV) and to improve the knowledge of the energy dependency of the neutron efficiency.
Neutron source details (TSL) Both TSL (Uppsala) and Louvain source look reasonable. Louvain could not be used before 2007 (TMAX=68 MeV) • No beam extraction signal. • n are produced with proton on 7Li target, 3 m collimator, sweep magnet. • n energy peaked at cyclotron energy; low energy tail. • n timing phase-locked to main cyclotron RF with narrow pulse duration: sTOF=1.53 ns. • Beam spot increases linearly with distance from target: use a circular collimator 2 cm diameter at 3 m. • Approved on 18 May 2006: code F183 assigned • Allocated beam time: 16-27 October 2006, 8 shifts of 8 hours assigned. • Cost: 400 Euro/hour (half paid on TARI)
Details on DAQ • Scintillator trigger: Side 1 – Side 2 coincidence (T1=S1×S2) • Calorimeter trigger: based on analog sum of the signals of the first 4 plan out of 5 (T1=A×B). • Trigger signal is phase locked with RF signal (T1 free). • Vetoed from retriggering by a 5-35 ms busy signal and by the DAQ busy. • The final trigger signal is: T2 = T1free.AND.NOT(BUSY). T2/T1FREE • T1free, T2, and the n monitor signals are acquired by a scaler asynchronous from DAQ. • Fraction of live time: T2/T1free; essential for the efficiency evaluation. Thr (mV) • Neutron rate proportional to neutron monitor via neutron flux intensity (I0) and peak fraction (fP) • An absolute rate calibration should be provided by scintillator counter. • Calorimeter scintillator efficiency rate is almost independent from beam monitor.
40 ns Time structure RF Macro structure 2.4 ms Calorimeter Trigger signal 4.2 ms 5 ns FWHM 41 ns
Test of phase locking Beam RF T1(Free) Test done with a random trigger at 60KHz
Scintillator calibration Trigger threshold calibration: mV to ADC counts b source to set the energy scale in MeV: 90Sr b endpoint 0.564 MeV; 90Y b endpoint 2.238 MeV. Fit of the b spectrum, with ADC counts to MeV factor as a free parameter. S1(ADC counts) 1.15 count/mV S1 0.021 MeV/count Thr (mV) ADC counts S2(ADC counts) S2 0.023 MeV/count 1.02 count/mV ADC counts Thr (mV)
Calorimeter calibration • Cell response equalized: MIP peak at 600 ADC counts. • Trigger threshold calibration: • - HP attenuators used for SA and SB not to exceed the dynamic range of the ADC; different attenuation factors: fA=2.0, fB=1.7. • - Threshold in counts studied with different methods. • Energy scale set with MIPs using the conversion factor from KLOE: a MIP in a calorimeter cell corresponds to an electron of 35 MeV. A 1.6 count/mV B 2.0 count/mV ADC counts mV
Data – fast MC comparison - 2 e(EKIN) Worse agreement if we assume an efficiency increasing with energy. EKIN (MeV) ns b EKIN (MeV)
Clustering For each side: group adjacent cells in “side cluster”. For event with at least a “side cluster” on each side, compute “event cluster” information.
Side A: x and z coordinates Weighed energy average on cell: Z 0 0 X
Side A: time and energy Weighed energy average on cell: Sum of cell energies:
Cluster: coordinates Y 0 n Z X 0
Signal development time - 1 Time difference between a cluster in one of the first four plans (trigger) and one in the fifth plane. As a reference, KLOE expected time resolution for 5-20 MeV photons is 0.8-0.3 ns. n ns
Signal development time - 2 Difference between the cluster time (computed as energy weighed average) and the time of the cell making up the cluster itself. As a reference, KLOE expected time resolution for 5-20 MeV photons is 0.8-0.3 ns. ns ns
Energy response 180 MeV neutrons • MC energy distribution is too broaden and no energy direct measurement can be done. • Little correlation between released and incident energies. • Data energy distribution peaked at 20 MeV.
Calorimeter details cladding TR= 21 TR= 21 36 core • 1 mm diameter scintillating fiber (Kuraray SCSF-81, Pol.Hi.Tech 0046), emitting in the blue-green region, lPeak<460nm. • 0.5 mm lead grooved layers (95% Pb and 5% Bi). • Glue: Bicron BC-600ML, 72% epoxy resin, 28% hardener. • Core: polystyrene, r=1.050 g/cm3, n=1.6 • Cladding: PMMA, n=1.49 • Only 3% of produced photons are trapped in the fiber. But: small transit time spread due to uni-modal propagation at 21, small attenuation (l=4-5m), optical contact with glue (nGLUEnCORE) remove cladding light 1.2 mm 1.0 mm 1.35 mm
Base module (198 fibers): LEAD GLUE FIBRES Details on calorimeter simulation • Old simulation: lead-scintillator layers (GEANT3) • New simulation: with FLUKA, using lattice tool, the fiber-lead structure has been designed and replicated 200 times. • Active material (fibers + cladding): polystyrene C2H3 homogeneous material with r=1.044 g/cm3 (average between cladding and core). • Passive materials: lead foils, 95% Pb and 5% Bi homogeneous compound. • Glue: 72% epoxy resin C2H4O, r=1.14 g/cm3, • 28% hardener, r=0.95 g/cm3, • hardener details: 200 layer replicas:
MC details: Birks parameters without Birks effect • Birks effect is important for neutron detection: the energy is released essentially by protons. • Birks parameters highly dependent from the scintillating material • Can be measured on KLOE data using protons from Dafne machine background (photo production on beam pipe and quadrupoles), • see: C. Bini, www.lnf.infn.it/kloe/private/memo/km330.ps