Download

1 / 25
250 likes | 269 Vues
HSC Data Analysis. Now we have NAPLAN, so what?. 1 The same story…. . w ith some tweaks. The essential story. Using NAPLAN. “How did our students go in this HSC course, compared with similar* students in other Catholic Schools?”

E N D
HSC Data Analysis Now we have NAPLAN, so what?
1 The same story…. with some tweaks.
The essential story Using NAPLAN “How did our students go in this HSC course, compared with similar* students in other Catholic Schools?” * - “Similar”: Gender, SES, prior achievement over all of secondary school. Hence, the tweak on the story: from a difference created in the last two years of school, to a whole-of-secondary-school effect. Using School Certificate • “How did our students go in this HSC course, compared with similar* students in other Catholic Schools?” • * - “Similar”: Gender, SES, prior achievement two years ago.
2 How strong a model does NAPLAN give you?... … compared to one based on the School Certificate
You wouldn’t expect NAPLAN to give you as strong a base, because it’s longer ago… NAPLAN School Certificate
Conclusion: • NAPLAN gives a somewhat (14%) weaker base (than SC) for Analysis, but it is still quite statistically adequate to frame useful questions about teaching and learning – particularly when these can be in a whole-of-secondary perspective.
3 How does the NAPLAN base compare with SC in the Analysis The unique position of the 2013 cohort
Investigate a standard-form Primary Analysis…. This distance is the key variable, “MnDiff”, showing the difference between the position of the ellipse and the Achieved = Typical line. Achieved Our question becomes, “How similar are the values of MnDiffNap (calculated using NAPLAN as the base) to MnDiffSC?” Typical
Investigate a standard-form Primary Analysis…. This distance is the key variable, “MnDiff”, showing the difference between the position of the ellipse and the Achieved = Typical line. Achieved It is possible of course that the NAPLAN result could look very different to that based on School Certificate Typical
Think of the possibilities we could find for the relationship between MnDiffNAP and MnDiffSC Possibility 1: there’s no relationship at all. What would that look like? What conclusion would you draw from this sort of result?
Think of the possibilities we could find for the relationship between MnDiffNAP and MnDiffSC Possibility 2: they are absolutely related. What would that look like? What conclusion would you draw from this sort of result?
Well what did we actually find? (small drum roll please…)
Conclusion: • The HSC Data Analysis based on NAPLAN gives a similar picture of achievement vs what is Typical to that provided by the Analysis based on School Certificate.
4 The Naplan data used Choices, reasons for them, and effects
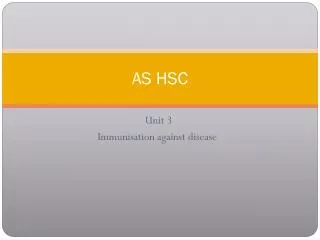
Literacy and Numeracy, 9 & 7 • Numeracy result is used as a stand-alone mark • Literacy = (Reading + Writing +(GrammarPunctuation + Spelling)/2)/3 • Chose Literacy rather than the individual components because: • Intuitively meaningful • Reduces number of variables, hence helps models to resolve • Enables better dealing with missing data • Surprised to find that Year 7 results still have an independent relationship with HSC • Even though it is often small • Or sometimes negative – there’s a story there.
Accessing your NAPLAN data • Download Data > All Data • oBOSTES had difficulty getting good matches for 2009 Year 7, so you may find some data missing where you can access it through SmartData • Thanks to all Diocesan Officers who were able to do the 2011/2009 data dump to enable the process to start. • The Missing Data facilities in the Analysis were used this year; previously, students needed a complete set of SC results to be included. From this year, values for some missing data could be estimated by relationships within the analysis. • As a minimum, some of the Year 9 results were needed. • The facts that the missing data estimations were used, and that NAPLAN is a national test, meant that a larger rather than smaller percentage of students were included in the 2014 Analysis.
5 Observed effects in the Analysis Only four so far, but can you see more?
Effect #1: Ellipses are wider 2014, on NAPLAN 2013, on SC Slightly weaker model > Slightly larger uncertainties > Slightly wider ellipses
Effect #2: Decrease in the number of out-of-range-of-Typical results • In 2013, across all courses done with a SC base, there were: • 331 “Achievement Above Typical Range” results • 3001 “In the Typical Range” • 369 “Below the Typical Range” • In 2014, across all courses done with a NAPLAN base, there were: • 191 “Above typical” • 3113 “in the Typical Range” • 179 “Below the Typical Range” Slightly weaker model > Slightly larger uncertainties > Slightly wider ellipses > more cut the line of Achieved=Typical > Fewer out-of-range
Effect #3: Increase in the ratio between Above and Below Typical • In 2013, across all courses done with a SC base, there were: • 331 “Achievement Above Typical Range” results • 3001 “In the Typical Range” • 369 “Below the Typical Range” • i.e., 38 fewer results above than below • In 2014, across all courses done with a NAPLAN base, there were: • 191 “Above typical” • 3113 “in the Typical Range” • 179 “Below the Typical Range” • i.e., 12 more results above than below. Is this an artifact of the open-ended nature of the NAPLAN scale?
Effect #4: Small class exclusion • Previously, under SC, classes of about 4 or 5 were the smallest that would model. • Now, under NAPLAN, classes of about 5 or 6 are the smallest. Slightly weaker model > Slightly larger uncertainties > Slightly wider ellipses > more non-significant results
6 Other changes in the 2014 Analysis Mostly based on user requests
Other changes 2014 • Two courses have new BOS numbers, so will have only one year appearing on their Trends graphs • General Mathematics becomes Mathematics General 2 BDC • 26699 Information Technology Exam becomes 27399 Information and Digital Technologies Exam • Mathematics Extension 2 students now have all band reporting done as Notional Bands • “Typical” has replaced “Expected” as the description of the modeled result • All references to UAI are now gone – we use “TES” because this remains the basis of the ATAR (as it was for both UAI and TER). • The School Summary (Numeric Report 4) now includes the field “Diff”, which has always been its sorting field. • The meaning of the “Incl” figure in the Overall School Result has changed slightly, to be more accurately a reflection of Graph 3. • Report 8 has been removed. It was mostly a SC summary, and the NAPLAN equivalents can be gained from Download Data > All Data. • Scatterplot graph names have been reversed to make them consistent. (Ach vs Typ, rather than Typ vs Ach.)
How have our students gone in this HSC course, compared to similar students in other Catholic schools?