Download
1 / 13
140 likes | 764 Vues
Interpreting Scatterplots. Presentation 2.3. Scatterplots. When looking at scatterplots, we will look for: Association (or direction) Form Strength Outliers. Direction. A trend that runs from the upper left to the lower right is said to have a negative association or direction.

E N D
Interpreting Scatterplots Presentation 2.3
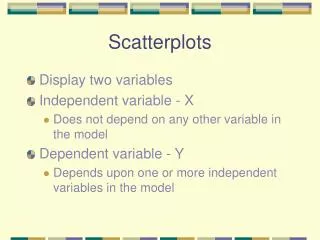
Scatterplots • When looking at scatterplots, we will look for: • Association (or direction) • Form • Strength • Outliers
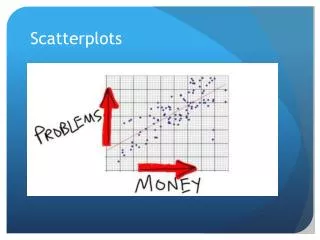
Direction A trend that runs from the upper left to the lower right is said to have a negative association or direction. A trend running the from the lower left to upper right has a positive association or direction. It is a lot like slope!
Direction • It is possible for a scatterplot to have no association or direction. • This occurs when the plot looks like a random splattering of dots.
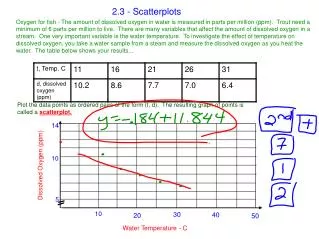
Form • Form: • If there is a straight line (linear) relationship, it will appear as a cloud or swarm of points stretched out in a generally consistent, straight form. • If the relationship isn’t straight, but curves, while still increasing or decreasing steadily, we can often find ways to make it more nearly straight.
Strength • Strength: • At one extreme, the points appear to follow a single stream (whether straight, curved, or bending all over the place). • At the other extreme, the points appear as a vague cloud with no discernable trend or pattern. • Note: we will quantify the strength soon (that’s the r).
Outliers • Outliers: • As before, points that do not follow the pattern. • Outliers may be in either the x-direction, y-direction, or both directions. • There’s no better example than the 2000 presidential election.
Outliers • 2000 Presidential Election • Remember Florida • The scatterplot on the next page details the number of votes for Bush and the number of votes for Buchanon. • As you would expect, the more people voting for Bush should mean more people voting for Buchanon (since there are simply more people voting). • In Palm Beach County there was much confusion about the ballot. • The Democratic Party alleged that the ballot was poorly designed thus skewing the vote. • The scatterplot shows the evidence.
2000 Presidential Election • Apparently in Palm Beach County only, a disproportionate number of people voted for Buchanon. • This point is a great example of an outlier. • The outlier is in the y-direction (vertical). • Why did this happen? • The next slide shows the ballot voters used.
Scatterplots • Remember, when looking at scatterplots, look for: • Association (or direction) • Form • Strength • Outliers
Scatterplots • This concludes this presentation.