Download
1 / 50
500 likes | 1.05k Vues
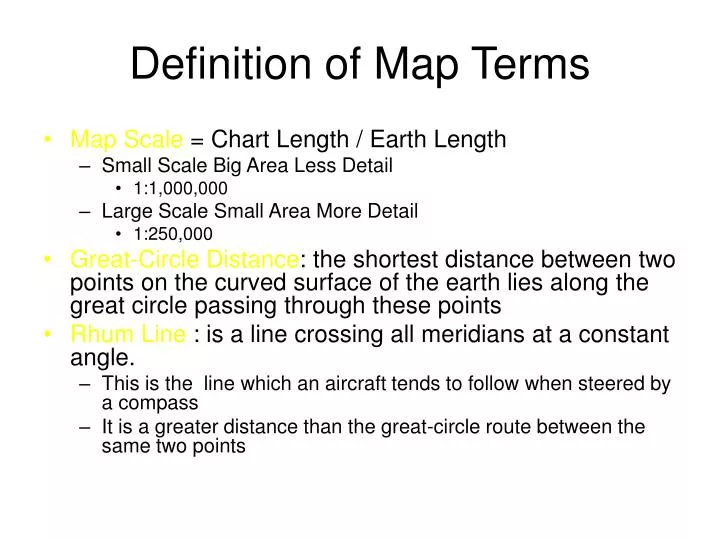
Definition of Map Terms. Map Scale = Chart Length / Earth Length Small Scale Big Area Less Detail 1:1,000,000 Large Scale Small Area More Detail 1:250,000

E N D
Definition of Map Terms • Map Scale = Chart Length / Earth Length • Small Scale Big Area Less Detail • 1:1,000,000 • Large Scale Small Area More Detail • 1:250,000 • Great-Circle Distance: the shortest distance between two points on the curved surface of the earth lies along the great circle passing through these points • Rhum Line : is a line crossing all meridians at a constant angle. • This is the line which an aircraft tends to follow when steered by a compass • It is a greater distance than the great-circle route between the same two points
Advantages to fly a Rhumb Line course instead of great circle • In low latitude, a R/L closely approximates a great circle • Over short distances, a R/L and G.C. nearly coincide • A R/L between points on or near the same meridian of longitude approximates a great circle
Definition of Map Terms • Conformality (correct representation of angles) : • To be conformal, a chart must have uniform scale around any points, though not necessarily a uniform scale over the entire map. 2. Meridians and Parallels must intersect at right angle Mercator and Lambert are conformal
Developed and Undeveloped Surface • The surface of sphere or spheroid is said to be undevelopable because no part of it may be spread out flat without distortion • A plane, cylinder or cone which can be easily flattened, is called developable surface . • Projection on these surface are termed Conical, Cylindrical, and Azimuthal Projection
Develop for flat of the earth 2.Cylinder 3.Cone 1.Plane Cylindrical Conical Azimuthal
Point of Tangency • Names of Chartsare different due to point of tangencysuch as a plane of projection tangent. • Tangent at the Equator, called Equatorial Proj • Tangent at the Poles, called Polar Proj • Tangent at other places, called Oblique Proj
Point of Tangency N N N E E W E W W S S S Tangent at Pole called “POLAR” Tangent at Equator called “EQUITORAIL” Tangent at other point called “OBLIQUE”
แบบการจำลองแผนที่ Projection • The method of representing all or part of the surface of a sphere or spheroid on a plane surface is called a map or chart project.
Projection Gnomonic Proj (Proj from the center of the sphere) Stereo Proj (Proj from the opposite side of the sphere) Orthographic Proj (Proj from the infinity)
AzimuthalProjection • Polar Tangency 3 names • Polar Azimuthal Gnomonic Proj • Polar Azimuthal Stergographic Proj • Polar Azimuthal Orthographic Proj • Oblique Tangency 3 names • Oblique Azimuthal Gnomonic Proj • Oblique Azimuthal Stergographic Proj • Oblique Azimuthal Orthographic Proj
Azimuthal Projection 3. Equitorail Tangency 3 names • Equitorail Azimuthal Gnomonic Proj • Equitorail Azimuthal Stergographic Proj • Equitorail Azimuthal Orthographic Proj
Common Charts Used in Navigation • Map Reading • Plotting and Measuring Course Directions and Distance
Ideal Chart • Comformality (รูปร่างเหมือนจริง) • Parallels and meridians must intersect at 90° • Scale or scale expansion must be the same along the meridians as it is along the parallels • Scale vary point to point but it is the same in all direction (Scale of any point independent from Azimuth)
Ideal Chart 2. Constant and Correct Scale • Constant ratio to bear to distance on the earth 3. Correct Shape Representation 4. Correct Area Representation 5. Coordinate Easy to Located 6. Rhumd Lines as Straight Lines (Mercator map) 7. True Azimuth
Cylindrical Projection (Mercator) • The only cylindrical projection used for air NAV is the MERCATOR • GERHARD MERCATOR design this type of chart first in 1569 • The other types of the Mercator are Oblique Mercator and Transverse Mercator N S Transverse MercatorPolar Cylindrical Gnomonic Proj Oblique Mercator Plane Mercator
Mercator Projection • Its graticule can be imagined by visualizing a cylinder tangent at the equator to a translucent globe with a light source at the center. • All parallels and meridians on the globe will be projected on the cylinder as straight lines crossing at right angles • Meridians will be evenly spaced, whereas distance between parallels will increase rapidly with latitude. • Scale on a Mercator is true only along the equator. Elsewhere it expands as the secant of the latitude, so that at 60°N or S , scale is twice that at the equator.
Best suited for use Mercator Projection is within 25 - 30° of the equator • In low latitudes, rhumb line and great circle will be close together; at middle and upper latitudes the amount of divergence becomes quite marked. • The great-circle route will always be shorter, and it is part of the navigator’s duty to determine whether the bother of plotting and the increased risk of error in flying a series of changing heading is justified by the saving in distance.
Characteristic of Mercator • Conformality • The meridians and parallel appear as straight lines, intersected together at right angle • Area • The area is not equal and are Greatly exaggerated in height Lat. • Scale • Scale correct only at the equator else where it expand as the secant of Lat . • Using mid-lat scale to measure distance • Great Circle appear as curve line convex to the nearest pole • RHUM Line appear as a straight lines (The meridian parallel together) • Rhum Line is the lines the success that cross the successive meridian at the same angle
Rhumb Line • Between 2 points, the shortest distance is the great circle • Fly by Rhum Line Track, the pilot must not change HDG all the time
The Advantage of Mercator • Position in Lat and Long are easy to plot • Easy to fly follow R/L track
The Disadvantage of Mercator • Difficulty of measuring large distance accurately • Conversion angle (C.A) must be applied to Great Circle bearing before plotting • The chart is useless in polar region above 80°N or S since the polar cannot be shown conversion angle
Conversion Angle • The meridians converge towards the poles . A Great Circle (GC) gives shortest distance between 2 positions while R/L running between the same position cut meridian at the same angle. • It is spiral curve and therefore represent a longer distance that means that there will be a difference between the R/L angle which the GC angle at the start point and the ending point of the track
Conversion Angle • Conversion Angle (CA) is the angular difference between a great circle bearing and a R/L bearing • Or angle between a great circle are joining two places on earth and a R/L between the two places • CA = (C’(CH) Long /2)× sin mean Lat
Difference of Long (D’ Long) is the angular difference between two longitude angle from 0 Long to 180º E and 180º W Long such as : from A to B D’Long = 150-15 =135 W Pri-meridian Greenwich Meridian 15ºW D’Long 135ºW NP 150ºW Anti-meridian
Change of Long (CH.Long) is the angular difference between two Longitude angles (In case of crossing prime-meridian or anti-meridian • From A to C CH.Long = 15W + 60E = 75E • From C to B CH.Long = 120E + 30W = 150W (180-60)+(180-150) CH.Long 75ºE A 15ºW C 60ºE Note: Same Direction (-) Difference Direction (+) East West CH.Long 150ºW B 150ºW
Difference of Lat (D’Lat) is the angular difference between two Lat. Angle . For instance, the north pole and the equator have a D’Lat of 90º from the north pole to the equator the D’Lat is 90ºS. If from the south pole to equator , D’Lat is 90º N • From 20ºN to 40ºN D’Lat = 20ºN • 1º = 60 NM yield 20ºN = 20×60 = 1200 NM 40ºN 20ºN 0º
Change of Lat (CH.Lat) is the angular different between two Lat angle (in case of crossing equator) such as from 30ºN to 30ºS CH.Lat is 60ºS. if from 30ºS to 30ºN CH.Lat 60ºN CH.Lat 60ºN 30ºN 0º 30ºS CH.Lat 60ºS
Example, When the A/C is in position Lat35°15’S Long 10°45’E and ground station is Lat 25°45’S Long 02°15’W what is conversion angle value? Solve CA=D’(CH) Long /2 × sin mean Lat CH Long = 10°45’E + 02°15’W = 13° Mean Lat = (35°15’S + 25°45’S) / 2 = 61°/2 = 30°30’ = 31° CA. = (13 /2) × sin 31 = 3°
Conic Projection • The Conic Projection bases on cone tangent reduce earth every place • The great majority of aeronautical chart in use today are based on conic projection • There are 2 classes of conic proj. • Simple Conic Proj with one Standard Parallel (S.P.) a lot of error • Conic Proj with 2 S.P. And expand out of S.P.
Lambert Conformal Conic Projection • In a simple conic project the cone is held tangent to the globe along a line of latitude called the “standard parallel”. • Scale is exact everywhere along this standard parallel, but increase rapidly above and below • Lambert visualized the cone as making a secant cut, thus giving two standard parallels • Scale along both is exact. Between them, scale is too small, beyond them too large.
For equal distribution of scale error, standard parallels are chosen at one-sixth and five-sixths of the total spread of latitude to be represented. • To map the U.S, whose lat is from 25° to 49 °, standard parallels of 29 ° and 45 ° (one-sixth and five-sixths of the total spread ) would produce an equal distribution of scale error.
Conic Projection Simple Conic Proj with one Standard Parallel (S.P.) Lambert Conic Proj with two Standard Parallel (S.P.)
101% 100% 98% 100%
The Lambert • All meridians are straight lines that meet in a common point beyond limits of the map • Parallels are concentric circles whose center is at the point of intersection of the meridians • Meridiansand parallels intersect at right angles • Since scale is very nearly uniform around any point on a given chart, it is considered a conformal projection • For map reading and radio navigation the projection is unequaled , and most areas of the world through 80 latitude are covered by aeronautical charts with scale of 1:500,000 and 1:1,000,000 • Above 80 , scale on a standard Lambert is too inaccurate for navigational use.
Characteristic of The Lambert • Conformal • Scale correct on S.P. contracted inside and expand outside • Area – not an equal area • Shape – distortion small • GC. – curves concave to parallel of origin considered as straight line • Rhumb Line curves concave to nearer pole • Graticule – meridians straight line , - parallel concentric circle
Polar Stereographic Projection • A flat surface is used, touching the N.P. • The light is at the S.P. • The polar sterographic is modified by using a secant plane instead of tangent plane • A secant เส้นตรงที่ลากตัดส่วนโค้ง NP 90°N SP
Modified polar stereographic proj. used secant plane as plane of tangency (Graticule) • The meridians are straight lines, radiating from the pole. • The parallels are concentric circles expands away from the pole 180 NP 090 270 0 Polar Sterographic Graticule Greenwich Meridian
Characteristic of Stereographic • Conformal • Correct at pole tangency • Shapes: distorted away from pole • Area: distorted away from pole • GC. Curve concave to pole to 90° N, considered as straight line about 70°N • Polar Stereographic used only 80°N near north and south pole
Map Reading • Determination of the aircraft position by matching natural or built-up features with their corresponding symbol on a chart • Parallels and Meridians Prime Meridian is 0 reference for Lat Pass Greenwich Parallel of Latitude Equator is 0 reference for Lat Longitude Meridian
Latitude and Longitude • Latitude range from 0° at the equator to 90°N and 90°S at the pole • Longitudeis measured around the earth both eastward and west ward from Prime meridian, through 180° • Geographic Coordinate System • Read intersection of Latitude and Longitude • Lat first then Long • U-Tapao : Lat 12°40’N Long 101°04’E
Grid System • GEOREF System (GEO GRAPHIC REFENCE SYSTEM) Consist of 4 letters and 4 numbers • Divided meridian 360° / 15° = 24 spaces • Each 24 has letter run from A to Z except I and O, start from south pole 90°S and Long 180° • Divided Latitude 180° / 15° = 12 spaces • Each 12 space has letter run from A to M except I • Total 288 spaces (15°× 15 º) per each 2. Each sqr (15°× 15 º) divided by 15º = 1º • Define letter A to Q except I and O • Total 225 spaces (1°× 1 º) per each 3. Each 1º divided by 60 = second Reading: Right – Up or Long - Lat
Aeronautical Chart • Charts for Visual Flight Rules (VFR) • World Aeronautical Charts (WAC) 1:1,000,000 • Sectional Charts 1:500,000 • VFR Terminal Area Charts 1:250,000 • Charts for Instrument Flight Rules (VFR) • Enroute Chart • Standard Instrument Departure (SID) • Standard Terminal Arrival (STAR)
World Aeronautical Chart (WAC) • WACs are used for plotting and pilotage • WAC is published by the US.Coast and Geodetic Survey • Scale is 1:1,000,000 They are based on • Lambert conformal project 0° to 80°N and 80°S • Modified Polar Stereographic Project from 80°N and 80°S to the pole
สัญลักษณ์บนแผนที่ • แสดงรายการของภูมิประเทศ (Topographical Symbols) • แสดงรายการเกี่ยวกับการบิน (Aeronautical Symbols)
แสดงรายการของภูมิประเทศ(Topographical Symbols) • แสดงรายการความสูงของพื้นที่ มี ๔ วิธี • เส้นลายขอบเขา (Contour Lines) • ทุกๆจุดบนเส้นลายขอบเขามีความสูงจากระดับน้ำทะเลเท่ากัน • เส้นชั้นความสูงอยู่ชิดกัน แสดงว่าบริเวณนั้นสูงชัน • เส้นชั้นความสูงอยู่ห่างกัน แสดงว่าบริเวณนั้นเป็นที่ราบสูง • ด้วยสี (Gradients Tints) • S.L. – 1,000 ft : dark green • 1,000 – 2,000 ft: weak green • 2,000 – 10,000 ft : brown to dark brown
3. ด้วยตัวเลข (Spot Elevation) • แสดงระยะสูงที่แน่นอนด้วยตัวเลข จากระดับน้ำทะเล 4. ด้วยลายเส้นและแลเงา (Hachure or Shading) • ลายลึก หรือแลเงาหนาทึบ แสดงว่า ลาดชันมาก 5. แสดงรายการของพื้นน้ำ (Drainage or Hydrography) • Blue 6. แสดงสิ่งก่อสร้างที่มนุษย์สร้างขึ้น (Cultural Features) • Chart Legend 7. แสดงบริเวณป่าและพืชผล (Vegetation)