Download
1 / 30
300 likes | 423 Vues
Regional Climate Alliances Spring 2008. 2/27/2007 15% below 2005 by 2020 cap and trade. 11/15/2007 set emissions targets by 11/15/08 ~60-80% cuts by ???? (2040?) cap and trade; C inventory, reporting full implementation by mid-2011. 12/20/2005 cap emissions at current levels

E N D
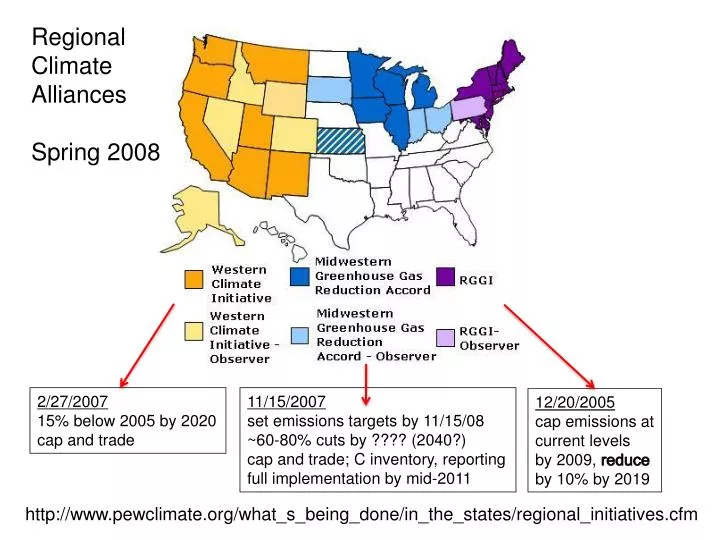
Regional Climate Alliances Spring 2008 2/27/2007 15% below 2005 by 2020 cap and trade 11/15/2007 set emissions targets by 11/15/08 ~60-80% cuts by ???? (2040?) cap and trade; C inventory, reporting full implementation by mid-2011 12/20/2005 cap emissions at current levels by 2009, reduce by 10% by 2019 http://www.pewclimate.org/what_s_being_done/in_the_states/regional_initiatives.cfm
Regional Climate Alliances Spring 2010 Dec 20, 2005, eff. 1/1/09 Nov 15, 2007, in devt Feb 26, 2007, eff. 1/1/12 (goal = -15% of 2005 levels by 2020) June 25, 2008, not eff. yet
Regional Climate Alliances Spring 2012 Transportation Climate Initiative (2010 declaration from 11 states)
X X Regional Climate Alliances Spring 2013 X X X X * no action since 2010 * now only CA and Canadian provinces
Regional Greenhouse Gas Initiative (RGGI) • set regional limits on GHG emissions from electric power plants & transportation • based on “Model Rule”, but each state can design their own strategy • for implementation (state targets set for 2009 emissions) • came into force in 2009 • power plant emissions remain constant through 2014, fall by 10% by 2018 • “cap & trade” mechanism: each state will set GHG limits and then issue • permits equal to the tons of CO2 allowed by the cap
Basic elements of Model Rule: • applicability: applies to fossil fuel-fired electric generating units >25MW • (covers 25% of regional GHG emissions) • 2) size & structure of cap: • a) states must stabilize power sector CO2 emissions at 2009 emissions during implementation (2009-2014) • b) then reduce emissions by 2.5%/yr for 2015-2018 • (total reductions of 10% below 2009 levels by 2018) • 3) permitting: each CO2 source must have approved CO2 budget emission monitoring plan (EMP); developed by state energy regulators • 4) allowance allocation: most CO2 allowances auctioned off (vs. ETS) • 25% allowances to support consumer benefit programs • 5) temporal flexibility mechanisms: • facilities can “bank” or “rollover” CO2 allowances • early reduction allowances granted for early demonstrated reductions • extended compliance period • 6) price triggers: • stage 1: if CO2 allowance cost >$7, CO2 offsets can increase • stage 2: if CO2 allowance cost >$10, CO2 offsets increase more, • compliance period extended, international CO2 credits allowed
Basic elements of Model Rule: (cont) • emissions monitoring: CO2 unit must install and certify monitoring system, report quality-controlled data (borrows from EPA acid rain program) • offsets: awards CO2 offset allowances to projects outside capped sector that sequester/reduce CO2 emissions (limited to 3.3% of unit’s total compliance obligation) • - must prove “additionality” • Who stands to gain here? • Who stands to lose? • Or is it that simple? • What would you do as a power company in a RGGI state? • What is leakage? and how does it impact RGGI?
LEAKAGE • - a shift of electricity generation from capped sources subject to RGGI to higher-emitting sources not subject to RGGI. • -impossible to predict ahead of time (market and political forces unknown) • -RGGI proposes to: • track load vs. generation • monitor C-intensive nature of non-RGGI power • policy options:1) reduce electricity demand (efficiency), so indirectly reduce leakage • 2) limit the amount of CO2 (<xx lbs CO2/MWh) that could be “emitted” through long-term purchasing agreements between RGGI utilities and regional power plants • 3) emissions portfolio standard
How did the states dole out allowances? • different than ETS, most allowances auctioned off; • last auction in December, 2012: 100% of allowances auctioned off
How much money did they make? Across three past CO2 allowance auctions, cost ~$1.93/ton
How much did it cost the average customer? Distributing the CO2 allowance costs around the ratepayers in those States, RGGI costs added $0.43/month to the average electric utility bill. Where did all this money go?
Improvements Feb 13 2013 • will cut 2014 allowance by 45%, decrease by 2.5% thereafter • (goal is to reduce emissions by 45% below 2005 levels by 2020) • cost containment = $4/ton in 2014, $6 in 2015, up to $10 in 2017 • (estimate additional $2.2billion in funds for reinvestment) • new forestry offset protocol • better tools to address “leakage”
Categories of State GHG activities • Vehicle Emissions Standards • Renewable Portfolio Standards • 3) Efficiency Standards/Programs • 4) Cap and Trade programs Most content in the following section from Center for Climate and Energy Solutions (c2es.org)
Vehicle Greenhouse Gas Emissions Standards – California leads the way 2002: CA passes law requiring 30% emissions reductions by 2012 2002-2007: EPA stalls on granting CA waiver to step outside federal emissions standards in response to industry complaints 2007: CA files lawsuit against EPA for stalling 2009: EPA grants CA waiver to set standards *if* changes to 2016 timelines to be consistent with Obama CAFE standards
Federal Corporate Average Fuel Economy (CAFÉ) standards CAFÉ standards current: 35.5 by 2012-1016 future?: 54.5 by 2025
Low-carbon Fuel Standard: a lifecycle analysis of trans. fuel sources Ex from California: fuel providers must reduce C intensity of fuel mix 10% by 2020
Renewable Portfolio Standards Ranges from: CA: 33% by 2020 TX: 5% by 2015 NY: 30% by 2015 CO: 30% by 2020 NC: 12.5% by 2021
Energy Efficiency Standards and Targets
Hydraulic Fracturing Chemical Disclosure Map
Public benefit funds Net metering programs allows costumers to sell electricity back to grid through electricity bills and/or utility charges Green Pricing GaPower optional: $5/100kwhr; green power w/ 50% solar; ~$50/month additional cost