Download
1 / 27
270 likes | 419 Vues
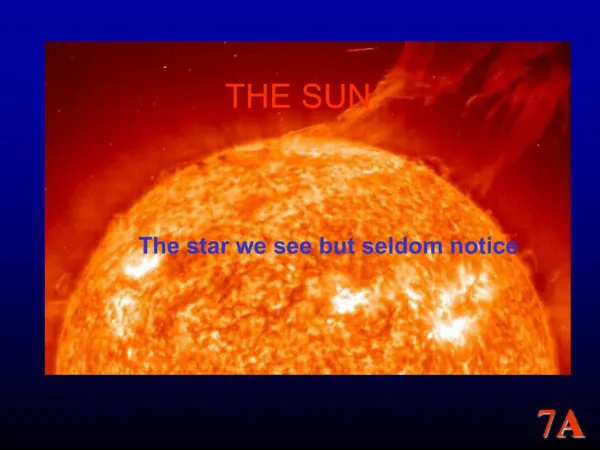
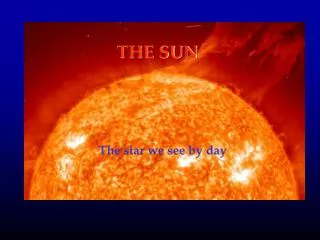
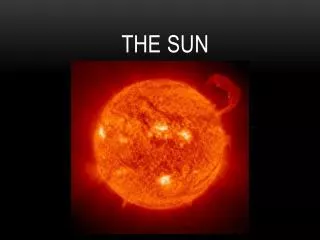
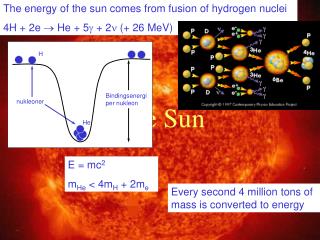
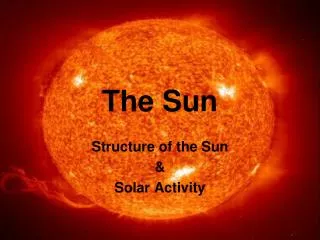
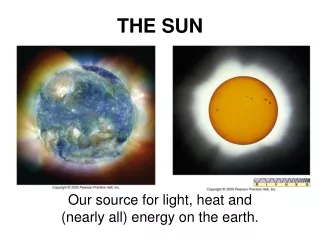
The Sun. The sun. What is the Sun? The Sun is a Star!. The size of the sun. Is the sun a large, small or medium sized star? The sun is an average size star. Surface of the sun. Is the sun calm or violent?

E N D
The sun • What is the Sun? • The Sun is a Star!
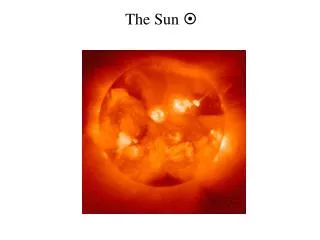
The size of the sun • Is the sun a large, small or medium sized star? • The sun is an average size star.
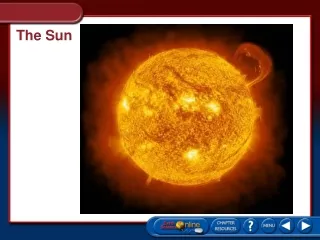
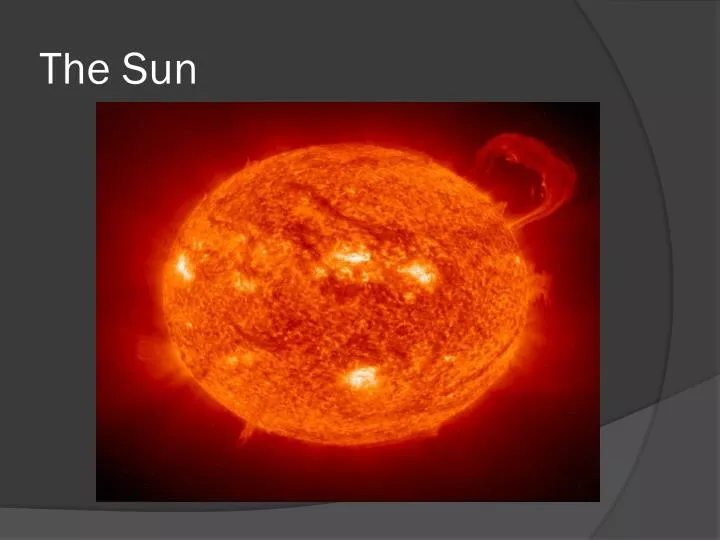
Surface of the sun • Is the sun calm or violent? • The sun is extremely violent, producing as much energy as 1 trillion megaton bombs every second.
The size of the sun • Why does the sun look so much larger then every other star? • The sun looks so much larger then every other star because it is so close. • Large Apparent Size (how it appears)
Solar Flares • Solar flares occur when energy stored up in the sun's magnetic field is suddenly released, throwing tons of negatively charged electrons into space and towards earth.
Sunspots • When a solar flare erupts, the area underneath is left cooler and therefore appears darker. • However, the temperature of a sun spot is still around 6,500° F • They would also appear bright if it was not for the brighter, hotter sun in the background.
Sun Spots The amount of sun spots at any times varies. Many Solar Flares Few Solar Flares
Sun spots • How do we see sunspots? • Some sun spots are small and are viewed by a projection telescope. Others are large enough to be viewed by the human eye (200,000 mi across) • DO NOT TRY THIS
What can solar flares do • Typically solar flares do very little. • The electrons crashing into our atmosphere create the Northern & Southern Lights at the poles. • They can also help bring up global temperature due to increasing of ozone.
Too many solar flares. • What can solar flares REALLY do? • Just as overloading your house with too much electricity can cause your power to go out. The sun can over load the earth with too many electrons from solar flares. • Without preparation the Earth “could” loose radio signals and electronics could be fried (sending us back to a time before electricity)… Imagine no Facebook.
Actually email from NASA Space Weather Message Code: ALTK06Serial Number: 293Issue Time: 2012 Oct 01 0151 UTCALERT: Geomagnetic K-index of 6Threshold Reached: 2012 Oct 01 0148 UTCSynoptic Period: 0000-0300 UTCActive Warning: YesNOAA Scale: G2 - ModerateNOAA Space Weather Scale descriptions can be found atwww.swpc.noaa.gov/NOAAscalesPotential Impacts: Area of impact primarily poleward of 55 degrees Geomagnetic Latitude.Induced Currents - Power grid fluctuations can occur. High-latitude power systems may experience voltage alarms.Spacecraft - Satellite orientation irregularities may occur; increased drag on low Earth-orbit satellites is possible.Radio - HF (high frequency) radio propagation can fade at higher latitudes.Aurora - Aurora may be seen as low as New York to Wisconsin to Washington state.
Cyclic Graph What is special about a cyclic graph? A cyclic graph repeats in a pattern.
Cyclic Graph parts Peak Lull What are the highest and lowest points called on a cyclic graph? Peaks are the upper parts of a cyclic graph. Lulls are the lowest points of a cyclic graph. Peaks and Lulls do vary. (Think: July is the hottest month. However, July is not always the same temperature each year)
Cyclic graph uses. • What can we do with a cyclic graph that we can not do with most graphs? ? By finding the trend of a cyclic graph, we can make predictions on the next sets of peaks and lulls.
How to predict from a cyclic graph. How do we predict the next peak or lull? 12 yrs 11 yrs 10yrs 11 yrs 12 yrs 11 yrs 10 yrs 11 yrs 44 yrs 5 6 7 9 8 9 6 8 0 0 44year/4peaks 11 years/peak Find the average amount of time between each Peak. Add peak average to the last peak. We would predict the next peak to be in 2011.
Rate of Change • What is rate of change? • Rate of change is how fast something changes over time • Change in field value • Time
Rate of change • If you had 50 sunspots in 2000 • And 100 sunspots in 2010. • What is your rate of change • [50 – 100] sunspots • 10 years • Our rate of change is 5 sunspots/year
Rate of change • Is a rate of change always positive? • NO. • A positive rate of change is called a? • Rate of increase is a positive rate of change • A negative rate of change is called a? • Rate of decrease is a negative rate of change
Rate of increase • How many years will you be at LMS? 2010 – 2013 How many years is that? 2010-2013 = 3 years 2010-2011 = 1 2011-2012 = 2 2012- 2013 = 3
Horizontal X axis Constant
Types of Graphs Direct Increase As X changes, Y goes up Direct Decrease As X changes, Y goes down Constant As X changes, Y remains the same ?
Dependent, Independent Dissolved Material Dependent axis Y - axis Time Independent axis (x axis) Which axis does not depends on the other axis? The X–Axis is Independent since it does not change according to the Y-axis The Y-axis is Dependent because it changes according to the x-axis The Y is the Why!
Sun Spots Lab Conclusion • What are sun spots and solar flares? • How can solar flares affect the Earth? • What can we do to prepare for them? • What is a Cyclic graph? • Give 3 examples of a cyclic graph. • What are peaks and lulls? • Explain how to make a prediction off of a cyclic graph. • How do you find rate of change? • Explain rate of increase & decrease.