Download
1 / 29
290 likes | 480 Vues
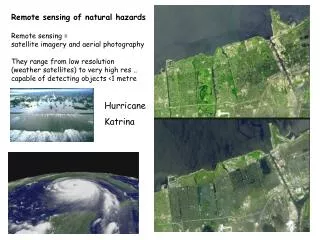
National Consortium for Remote Sensing in Transportation Security, Safety, Hazards, and Disasters. How Aerial and Satellite Remote Sensing Assist Transportation Planning and Mitigate Risks. Stan Morain Amelia Budge Earth Data Analysis Center University of New Mexico.

E N D
National Consortium for Remote Sensing in Transportation Security, Safety, Hazards, and Disasters How Aerial and Satellite Remote Sensing Assist Transportation Planning and Mitigate Risks Stan Morain Amelia Budge Earth Data Analysis Center University of New Mexico Applications of Remote Sensing Technologies for Transportation Data Collection Jacksonville, FL December 1-2, 2004
National Consortium for Remote Sensing in Transportation Security, Safety, Hazards, and Disasters Discussion Topics • Multispectral and Temporal Concepts • Terrain • Corridor Planning • Failures • Deformations • Roads • Updates & Maintenance • Safety & Incident Management • Hazardous Materials Transport • Airports
Local Inventory Single Source Data Simple Identification Manual Analysis Photographs Analog Recording Cameras Balloons Global Surveys Multiple Source Data Complex Problem Solving Machine Assisted Analysis Image & Non-image Data Digital Recording Electronic Sensor Systems Satellites National Consortium for Remote Sensing in Transportation Security, Safety, Hazards, and Disasters Increasing Complexity Concepts
National Consortium for Remote Sensing in Transportation Security, Safety, Hazards, and Disasters The Imaging Spectrometry Concept Concepts Each pixel has an associated, continuous spectrum that can be used to identify the surface materials. R Images taken simultaneously (e.g., in 200 or more spectral bands) inherently registered 0.4 2.5 Wavelength, µm
National Consortium for Remote Sensing in Transportation Security, Safety, Hazards, and Disasters Natural Resources Utilities Hydrology Sediment Topography Public Health Social Economic Legal Image Data Other Concepts Action Decision Decision Making Process Problem Information Manipulation & Analysis Measurement Modeling Monitoring Mapping Database
National Consortium for Remote Sensing in Transportation Security, Safety, Hazards, and Disasters T+n T+n T+1 T+1 T T Measurement, Mapping, Modeling, and Management Concepts Management requires constant refreshment of information obtained from measurement, mapping, and modeling. Time provides the means for making static data and information more dynamic. Outputs are more easily visualized in time and space when temporal and spectral attributes are fused. Measurement Information analysis for management decision making Mapping Modeling TN+1 TN T+1 T-M Time Data analysis and processing
National Consortium for Remote Sensing in Transportation Security, Safety, Hazards, and Disasters The Gulf Coast includes dense urban areas intermixed with designated natural areas, which influence or constrain development within the area. Gulf Coast Assessment Terrain: Corridor Planning Slide courtesy of NCRST-E
Preliminary Alternate Routes National Consortium for Remote Sensing in Transportation Security, Safety, Hazards, and Disasters Terrain: Corridor Planning Alt D-1 / D-2 Alt D-2 Alt D-1 Alt C-1 Alt C-1 D-1 Alt B-1 Alt B-1 Alt A-1 Alt A-1 Slide courtesy of NCRST-E
National Consortium for Remote Sensing in Transportation Security, Safety, Hazards, and Disasters LIDAR and Hyperspectral Data Collection Terrain: Corridor Planning Slide courtesy of NCRST-E
National Consortium for Remote Sensing in Transportation Security, Safety, Hazards, and Disasters What Worked Well?.....a Summary Terrain: Corridor Planning • Coordinated Data Collection • Key Data and Products: i.e., LiDAR, DEMs, Hydrological, Hyperspectral • Data Fusion • 3-D Landscape Views • Identifying Wetlands • Detailed Land Cover Analysis • Partnering With Industry Data Fusion Wetlands Land Cover Analysis
National Consortium for Remote Sensing in Transportation Security, Safety, Hazards, and Disasters Application Summary Terrain: Corridor Planning • Very near-term prime-time technology. • Successfully demonstrated in multiple states. • Promises to help bring meaningful streamlining tovarious NEPA processes. • Helps preserve the intent ofNEPA to consider all alternatives. • Needs to be pilot deployed and applications taken to production mode to allow delivery of finished information products rather than raw data. Slide courtesy of NCRST-E
National Consortium for Remote Sensing in Transportation Security, Safety, Hazards, and Disasters Assessing Transportation Lifeline Hazards Terrain: Failures A variable shaped neighborhood (function of hazard type, surroundings and time) is passed along a lifeline to assign a hazard value to each point or segment.
National Consortium for Remote Sensing in Transportation Security, Safety, Hazards, and Disasters Terrain: Failures General Strategy for Assessing Risk For Land Failures B A D C
National Consortium for Remote Sensing in Transportation Security, Safety, Hazards, and Disasters Terrain: Failures Visualization of Results
National Consortium for Remote Sensing in Transportation Security, Safety, Hazards, and Disasters Terrain: Deformations Las Vegas Interferogram ERS-2 data (the background image) are fused with ERS-1 data taken three years earlier to create an interferogram. From Professional Surveyor, Oct. 1999.
National Consortium for Remote Sensing in Transportation Security, Safety, Hazards, and Disasters Terrain: Deformations InSAR-derived displacement map of the Salt Lake Valley. The change in color scale indicates more subtle movements. The road network is shown in black with fault traces in white.
National Consortium for Remote Sensing in Transportation Security, Safety, Hazards, and Disasters Ikonos 1m DOQQ .33m data IRS-C 5m Roads: Updates & Maintenance Updating Roads Using Imagery
National Consortium for Remote Sensing in Transportation Security, Safety, Hazards, and Disasters 6.2 10.4 Ikonos IRS-C DOQQ 5.8 Roads: Updates & Maintenance Speed and Output Percent of Total Road Mileage Updated Total image evaluation time to total road mileage updated (min/km)
National Consortium for Remote Sensing in Transportation Security, Safety, Hazards, and Disasters Road Safety & Maintenance Tools Roads: Safety & Incident Management • Some tools in the rural road toolkit help managers • pinpoint areas of highest risk for flooding and washouts • dispatch maintenance crews efficiently to the most critical spots
National Consortium for Remote Sensing in Transportation Security, Safety, Hazards, and Disasters Roads: Safety & Incident Management Highway Safety Using Multi-Criteria Evaluation White dots show crash locations, black line is the road centerline along Route 17.
National Consortium for Remote Sensing in Transportation Security, Safety, Hazards, and Disasters Bridge Doctor / Bridge Hunter Roads: Safety & Incident Management • Bridge Hunter and Bridge Doctor algorithms locate bridges of interest and diagnose their structural integrity • Damage detection algorithms using high-resolution satellite imagery, offers timely coverage • These tools have been validated by the UDOT in Salt Lake City Courtesy ImageCat Inc.
National Consortium for Remote Sensing in Transportation Security, Safety, Hazards, and Disasters Roads: Hazardous Materials Transport Route, Risk, & Vulnerability Assessment Reduce losses and disruptions arising from hazardous materials transport by improving route, risk, and vulnerability assessments.Deploy an operational, geospatial system that provides enhanced route assessment, risk evaluation, and emergency response capabilities for hazmat transport.
10 National Consortium for Remote Sensing in Transportation Security, Safety, Hazards, and Disasters Roads: Hazardous Materials Transport Current Process and Proposed Deployment Solution Emergency Response Hazmat Route Selection Baseline Data Acquisition Route Assessment & Monitoring TRAGIS & NHMRR Existing Approach N/A Windshield survey Spreadsheet format Evacuation planning Re-routing DECISION SUPPORT SYSTEM TRAGIS & NHMRR High Moderate Low School Proposed Deployment Integrate NCRST-H GIT & resources Extended Functionality Online visualization & quantitative risk analysis
National Consortium for Remote Sensing in Transportation Security, Safety, Hazards, and Disasters Expected Outcomes Roads: Hazardous Materials Transport • Enhanced route assessment methods • Migration from spreadsheet to map format in the cab • Increased number of route assessment attributes • Insertion of risk and vulnerability data in assessment database • Migration from road alignment buffer to include sensitive features off-road • Online deployment of tools and resources
National Consortium for Remote Sensing in Transportation Security, Safety, Hazards, and Disasters 200ft 98° Primary Surface 98° 1000ft 13899 ft 13899 ft Runway 42532 ft (7nm) 42532 ft (7nm) 1000ft Primary Surface 98° 98° 200ft Centerline of Runway Specification of NIMA (NGA), 2001Airport Obstruction Analysis Airports Top View
National Consortium for Remote Sensing in Transportation Security, Safety, Hazards, and Disasters Airfield Facilities & Management Airports SBMA w/2.5m post-spacing DEM from aerial photos SBMA Photo SBMA aerial photo w/1m LiDAR DEM post spacings Courtesy, I.K. Curtis; Airborne-1; and, BAE Systems
National Consortium for Remote Sensing in Transportation Security, Safety, Hazards, and Disasters Glide Path Visualization Airports
National Consortium for Remote Sensing in Transportation Security, Safety, Hazards, and Disasters Obstruction Identification Airports Santa Barbara Municipal Airport Yellow = Terrain obstructs Red = Point obstructs Orange = OIS
National Consortium for Remote Sensing in Transportation Security, Safety, Hazards, and Disasters Contact Information NCRST-H Stan Morain, PI smorain@edac.unm.edu Amelia Budge abudge@edac.unm.edu