Download
1 / 16
160 likes | 316 Vues
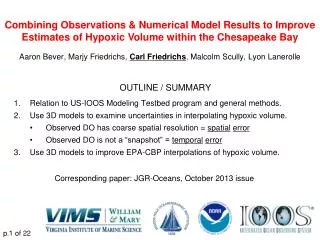
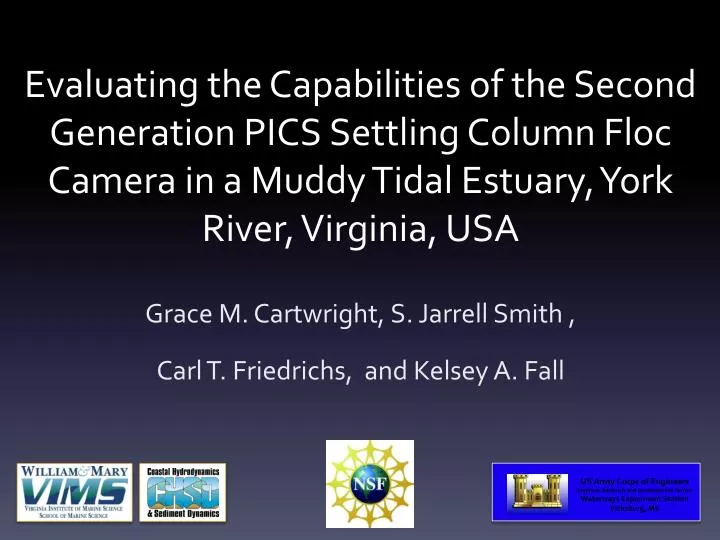
Evaluating the Capabilities of the Second Generation PICS Settling Column Floc Camera in a Muddy Tidal Estuary, York River, Virginia, USA. Grace M. Cartwright, S. Jarrell Smith , Carl T. Friedrichs, and Kelsey A. Fall. US Army Corps of Engineers

E N D
Evaluating the Capabilities of the Second Generation PICS Settling Column FlocCamera in a Muddy Tidal Estuary, York River, Virginia, USA Grace M. Cartwright, S. Jarrell Smith , Carl T. Friedrichs, and Kelsey A. Fall US Army Corps of Engineers Engineer Research and Development Center Waterways Experiment Station Vicksburg, MS
Motivation An Example Set of Bursts Independent verification Acoustic Doppler Velocimeter (ADV) Method Bulk Settling Velocity (Ws) of suspended sediment <C> is burst averaged concentration from calibrated ADV backscatter <w’C’> is burst averaged Turbulent Reynold’s Flux Cbackgroundis the lowest concentration observed during the study period ADV Concentration(mg/L) <w’C’> (mm/s)(mg/L) Bulk Bulk Settling Velocities for MUDBED Tripod Deployments (Dickhudt et al, 2009; Cartwright et al, 2011; Fugate and Friedrichs, 2002)
PICS – Particle Imaging Camera System Laser source settling column camera Laser source Side View 1mm light sheet 10 x 14 mm Current Top View (Smith- INTERCOH 2012)
Example PICS Video Sequence (1 m depth) 10/06/2012 14:06:00 (frames 001-080) collected at 8 frames/sec Fluid Velocity hinders sediment settling
PTV/PIV method to remove fluid velocity effects PTV: Particle Tracking Velocity individual particles ≥ 30 μm (3 pixels) PIV: Particle Image Velocity groups of particles ≤20 μm (2 pixels) Fluid velocities estimated for each cell from one frame to the next Particles are tracked from frame to frame A Thread is a particle tracked for at least 5 frames Peak velocity used for each cell (Smith and Friedrichs, 2012;Van Leussen and Cornelisse, 1993; Fennessy et al, 1994)
PTV/PIV method to estimate Ws, ρsand mass Calculated as the net of the Particle and fluid velocity vectors Averaged for all the frames in the track Particle Density Split into 3 classes: Density 1. primary > 1800 kg/m3 2. bed aggregate 1150-1800 kg/m3 3. flocculants < 1150 kg/m3 (Smith and Friedrichs, 2012; Oseen, 1927; Schiller and Naumann, 1933; Soulsby, 1997,)
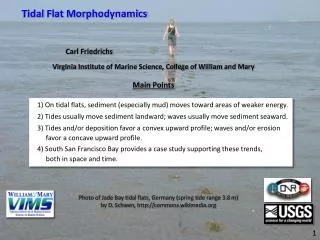
NSF MUltiDisiplinaryBenthic ExchangeDynamics Clay Bank area on York River Chesapeake Bay, VA Micro tidal ( 0.7 to 1 meter) Study Site Secondary Channel ~ 5 meter depth Seabed During Neap >75% mud ~10% Organics Sand D50 ~100 µm up to 30% Pellets (~60-90 μm) Kraatz, (2010, personal comm), Rodriguez-Calderon (2010)
October 6, 2012 2 days before Neap Slack-Slack bracket Flood (~6 hrs) Study Period Every Hour Water column “cast” 5-6 samples (~1/m) Bottom samples every 10-15 min Each Sample PICS Turbulence dissipate 15-30 sec Collect 30 sec burst @ 8 frames/sec Collect second burst ~1 min later ADV 2 minute burst @ 10 Hz LISST 2 minute burst@ 2/3 Hz CTD 2 minute burst@ 1 Hz Pump Samples 1 sample right away 2nd sample mid CTD burst (Picture from Smith and Friedrichs, 2010) Two Grab Samples of Bottom Sediment
20121006084703.seq 08:47:03 Example PICS Results Depth 5.8 m Number particles 400 d50,p= 54.7 μm d50,m = 68.1 μm ws50,p = 0.172 mm\sec ws50,m = 0.239 mm\sec By particle count Flocs: 75.5 % Bed Agg: 24.5 % Primary: 0.0 % By mass Flocs: 78.0 % Bed Agg: 22.0 % Primary: 0.0 % 3 classes: Density 1. primary > 1800 kg/m3 2. bed aggregate 1150-1800 kg/m3 3. flocculants < 1150 kg/m3
Preliminary Results Concentrating on bottom samples only
% >60 μm (by weight) from Pump Sample SPM % SPM > 60 μm
50 percentile grain-size from PICS For each sample -- 30-sec bursts approximately 1 minute apart
50 percentile settling velocity from PICS For each sample -- 30-sec bursts approximately 1 minute apart
Bulk settling velocity from PICS and ADV For each PICS sample -- 30-sec bursts approximately 1 minute apart
Future Work • Work up LISST data • Process the bottom sediment • Repeat Study for Spring Tide • PICS lab experiment to find • Ws for isolated fecal pellets (Figure from Smith and Friedrichs, 2010)