Download
1 / 11
110 likes | 238 Vues
Event-by-event search for charged-neutral fluctuation in Pb-Pb collisions at 158A.GeV. Madan M. Aggarwal Panjab University, Chandigarh (India) (e-mail : aggarwal@pu.ac.in ) For WA98 collaboration.

E N D
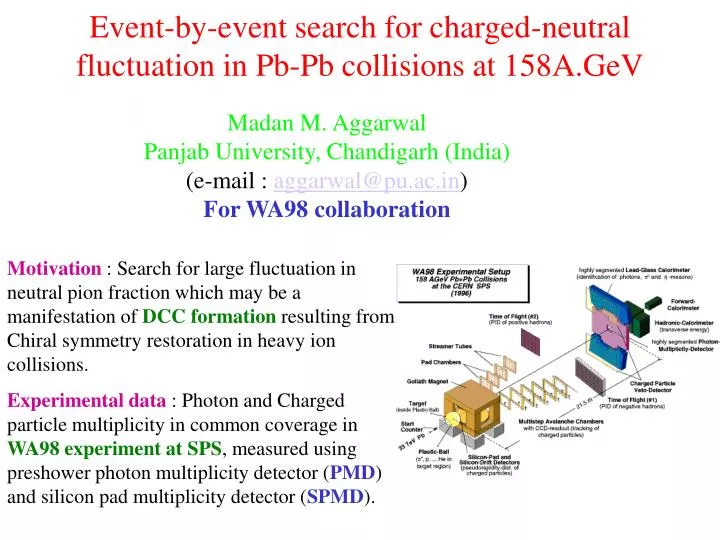
Event-by-event search for charged-neutral fluctuation in Pb-Pb collisions at 158A.GeV Madan M. Aggarwal Panjab University, Chandigarh (India) (e-mail : aggarwal@pu.ac.in) For WA98 collaboration Motivation : Search for large fluctuation in neutral pion fraction which may be a manifestation of DCC formation resulting from Chiral symmetry restoration in heavy ion collisions. Experimental data : Photon and Charged particle multiplicity in common coverage in WA98 experiment at SPS, measured using preshower photon multiplicity detector (PMD) and silicon pad multiplicity detector (SPMD).
Data selection and analysis • Centrality (from MIRAC) : 0-5%, 5-10%, 10-15% • -range : 2.9-3.75 (overlap of PMD and SPMD) • Calculate ƒ = N0 / N 0.5*N / (0.5*N + Nch) Normal events : Binomial distribution with peak at 0.33 DCC events : 1/ƒ distribution extending from 0 to 1. • Study ƒ in a azimuthal window for localized fluctuation Picture here for f-distr. in DCC and normal events Consider only photon-excess events (anti-Centauro type) : ƒ 0.55 high photon purity large Signal-to Background Comparison with mixed events and Venus+Geant events Total number of events : Data 196K, Mixed 196K, V+G 30K
Sliding Window Method (SWM) Scan the entire azimuthal range by sliding the window by 2° Calculate ƒ for each window Find max. value of ƒ in an event, ƒmax Collect patches with ƒmax 0.55 Study the statistical significance Analysis done for =40°, 60°, 90° An event with 90° patch having ƒ = 0.7
Previous Results (Poster @ QM2002) Events with ƒmax0.55 more frequent in data than in mixed, V+G Uniform distribution of patches in azimuth Preceding and Succeeding events normal More patches in less central events
Previous Results (Poster @ QM2002) No. of events per 10K with ƒmax 0.55 in Data, VENUS+GEANT and Mixed Events for =40°, 60°, 90°. Centrality selected by the MIRAC ET Centrality Event =40° =60°, =90° 0-5% top Data 185.9±4.7 16.8 ±1.4 0.9 ±0.3 V+G 0.7 ±0.7 1.6×10⁻⁶ 3.3 ×10⁻¹² Mixed 37.8 ±2.1 1.9 ±0.5 0 5-10% Data 325.0 ±6.5 69.3 ±3.0 2.7 ±0.6 V+G 1.2 ±1.2 1.2 ±1.2 5.5 × 10⁻⁸ Mixed 109.3 ± 3.8 14.8 ±1.4 0.4 ±0.2 10-15% Data 317.1 ±9.5 158.6 ±6.7 12.3 ±1.9 V+G 1.5 ±1.5 3.0 ±2.1 9.6 × 10⁻⁶ Mixed 120.0 ±6.3 56.9 ±4.3 1.6 ±0.7
Further investigations : Genuineness of events with filtered patches N-Nch plot for normal patches of = 60° (blue points) and filtered patches (red points) Filtered patches genuine outliers of the same parent distribution
N - Nch Difference in filtered and normal patches Difference Nf - Nr vs. Nchf - Nchr Nf,Nchf for filtered patch Nr,Nchr for randomly selected patch in another event (with similar total multiplicities) at the same Positive gamma difference Negative charged particle differece Genuine photon excess
Statistical significance of filtered patches Nch distribution in other part of SPMD Charged particle multiplicity similar in azimuthal region of filtered patch and other azimuthal regions in an event in the -region 2.35-3.0
DCC model • Assumptions • All pions in a patch are DCC type (DCC-I) • Pions with pT 250 MeV/c are DCC type (DCC-II) • Use VENUS events as normal type • +- 00 interchanged as per DCC probability in a 60° patch selected randomly in = 3-4 • After 0 decay, analyze the event with sliding window method • Ensemble NDCC : a mixture of normal (VENUS) and DCC (modified VENUS) events • Centrality selection (impact parameter) to match photon and charged particle multiplicity with data • Number of DCC model events : 25K
Comparison with a DCC model Varying % of DCC events All events DCC type 1. Extracted DCC events close to input values for ƒ 0.5, efficiency of SWM close to 100% for photon-excess events. 2. % of events fall more sharply with increasing ƒ for DCC-II, as in Data, Suggesting enhanced role of low pt pions 1. DCC model without pt selection Suggests < 1% of DCC events in the data, in conformity with earlier results. 2. DCC model with pt selection requires Higher % of DCC events in the data.
Summary There is a statistically significant excess of photon-rich patches in data than in V+G or in Mixed events, suggesting the presence of non-statistical fluctuation in neutral pion fraction. This excess is in conformity with the limits on DCC patches studied earlier using wavelets, but the sliding window method provides direct observation of the details of an event. These domains are not due to any detector artifacts. The percentage of events with photon-excess patches increases with decreasing azimuthal size of the patch with decreasing centrality Comparison with a simple DCC model favors a scenario where fluctuation might be due to low pt pions. Needs more investigation with model.