Download
1 / 11
130 likes | 294 Vues
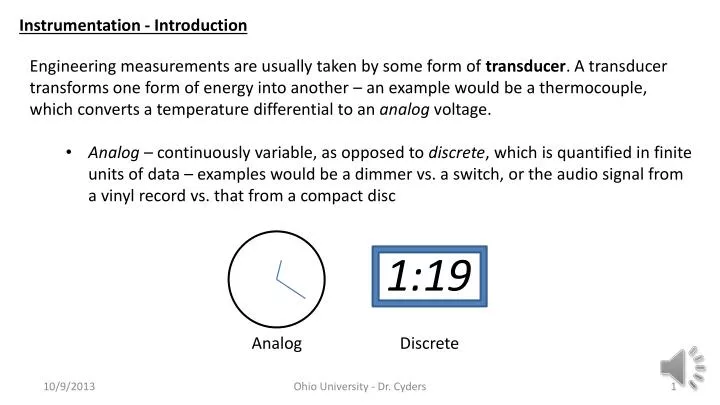
Instrumentation - Introduction. Engineering measurements are usually taken by some form of transducer . A transducer transforms one form of energy into another – an example would be a thermocouple, which converts a temperature differential to an analog voltage.

E N D
Instrumentation - Introduction • Engineering measurements are usually taken by some form of transducer. A transducer transforms one form of energy into another – an example would be a thermocouple, which converts a temperature differential to an analog voltage. • Analog – continuously variable, as opposed to discrete, which is quantified in finite units of data – examples would be a dimmer vs. a switch, or the audio signal from a vinyl record vs. that from a compact disc 1:19 Analog Discrete Ohio University - Dr. Cyders
Instrumentation - Introduction • Usually, engineering transducers are set up to either be read visually or to produce an electrical signal that can then be conditioned and converted to a discrete digital signal by a data acquisition system with an analog-to-digital converter (ADC). Digital signals can then be manipulated for analysis on a computer. • Signal Conditioning – altering a signal using tools such as filtering and amplification to prepare it for further processing • Data Acquisition System (DAQ) – system used to collect and record analog signals, usually in digital (discrete) form • Analog-to-Digital Converter (ADC) – device that converts analog signals to digital (discrete) data 1:19 Analog Discrete Ohio University - Dr. Cyders
Instrumentation – Analog Device • Ashcroft 1008S Analog Pressure Gauge • Bourdon tube design • Full Scale Range- 100 psi • Resolution - smallest measurement change in input variable that can be detected and indicated – 2 psi • Accuracy – deviation of the reading from the real value - ±1.6% Full Scale (1.6 psi) • Random or Human Error • Graduations - ±1 psi • Parallax Picture: http://www.instrumart.com/assets/1008A1_200.jpg Ohio University - Dr. Cyders
Instrumentation – Analog Device • SSI Technologies P51-100 Pressure Transducer • Strain Gauge Diaphragm design • Full Scale Range- 100 psig • Resolution – dependent on DAQ • Accuracy – ±0.5% Full Scale (0.5 psi) • Random Error • Noise • Input Voltage – voltage supplied to power transducer – 8 to 30 VDC • Output Voltage – 1 to 5VDC Ohio University - Dr. Cyders
Instrumentation – A Brief Diversion - Number Systems • Think of the decimal number system (what we commonly use) as a series of switches. Each switch has ten settings, zero through 9. The first switch denotes the multiplier of 100, the second, of 101, and so on. The numbers are then added to calculate the total value represented. • Example: 7*(102) + 4*(101) + 2*(100) = 742 Ohio University - Dr. Cyders
Instrumentation – A Brief Diversion - Number Systems The binary system works the same way, but with switches having only two settings, 0 (off) and 1 (on). Because the switches have only two values, they are multiplied by successive powers of two. • Example: 1*(24) + 0*(23) + 1*(22) + 0*(21) + 1*(20) = 21 Ohio University - Dr. Cyders
Instrumentation – Digital Acquisition System • Analog-to-digital conversion works essentially the same way whether you’re reading a gauge visually or using an analog to digital converter. Since analog devices usually have theoretically continuous behavior, resolution is usually limited by the bit depth of the ADC. • Bits are the most basic unit of memory, representing a binary number (0 or 1, transistor switch) • The number of divisions over the full scale reading is equal to 2n, where n is the bit depth of the ADC. 5 bits Example: 5 bits gives 32 divisions (00000 through 11111) Ohio University - Dr. Cyders
Instrumentation – Resolution Analog Signal 3-bit Digital Signal n: Bit-depth of ADC (3 in this case) VD: Full-scale input voltage on ADC (5 Volts in this case) VS: Full-scale output voltage on analog device (5 Volts in this case) B: Range type (0 for unipolar, 1 for bipolar; 0 in this case) RFS : Full-scale range of input value (100 psi in this case) 5 V 5 V 100 psi 111 110 101 100 57.5 psi 011 45.0 psi 56.6 psi 42.8 psi 2.25 V 2.88 V 37.8 psi 2.83 V 1.89 V 2.14V 010 001 000 0 V 0 V 0 psi Ohio University - Dr. Cyders
Instrumentation – Resolution Amplified Analog Signal Analog Signal 3-bit Digital Signal n: Bit-depth of ADC (3 in this case) VD: Full-scale input voltage on ADC (5 Volts in this case) VS: Full-scale output voltage on analog device (4 Volts in this case) B: Range type (0 for unipolar, 1 for bipolar; 0 in this case) RFS : Full-scale range of input value (100 psi in this case) 5 V 5 V 5 V 100 psi 100 psi 111 110 101 100 Amp 011 010 1 V 0 psi 001 000 0 V 0 V 0 psi Ohio University - Dr. Cyders
Instrumentation – Digital Acquisition System Example: An SSI P51-100 pressure transducer (0-100 psi, 1-5 V) is connected to a 10-bit ADC that can read 0-5V signals. The resolution on the ADC output for this range would be: This is known as zero-order uncertainty in the instrument. We generally combine error sources using a root-sum-square. We know of at least two major error sources: transducer accuracy and ADC resolution. Transducer accuracy: ±0.5 psi (stated by manufacturer), error due to resolution: ±0.061 psi (half the resolution). Total uncertainty due to these two sources: Actual pressure: 46.90 psi Measured pressure: 46.8 psi ±0.5 psi Ohio University - Dr. Cyders
For more information, go to http://www.library.ohiou.edu and search the ALICE catalog for The Uncertainty in Physical Measurementsby Fornasini – it is an electronic resource you can access anywhere with your student login