Download
1 / 36
360 likes | 488 Vues
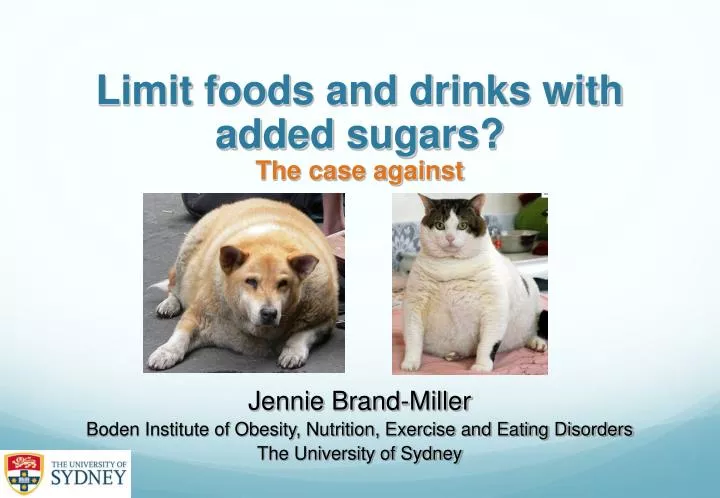
Limit foods and drinks with added sugars? The case against. Jennie Brand-Miller Boden Institute of Obesity, Nutrition, Exercise and Eating Disorders The University of Sydney. If everyone is thinking alike Then somebody isn’t thinking George S. Patton. The dogma.

E N D
Limit foods and drinks with added sugars? The case against Jennie Brand-Miller Boden Institute of Obesity, Nutrition, Exercise and Eating Disorders The University of Sydney
If everyone is thinking alikeThen somebody isn’t thinkingGeorge S. Patton
The dogma Added sugars are ‘empty’ calories/kilojoules Added sugars cause micronutrient deficiencies Added sugars stimulate appetite Added sugars make you fat Cutting added sugars will cause weight loss Reducing added sugars will prevent tooth decay
My focus Added sugars make you fat Cutting added sugars will cause weight loss
Honey in human diets “Intakes at various times during history may well have rivalled our current consumption of refined sugar” “Sugarbag” Allsop and Brand-Miller Brit J Nutr 1996
A long history of bee-keeping The Ancient Egyptians had a steady supply of honey from their domesticated bees “Cylindrical hives were made of clay and stacked horizontally on top of each other in rows up to eight in height, a total of up to 500 hives” From the tomb of Pabasa, 7th century BC
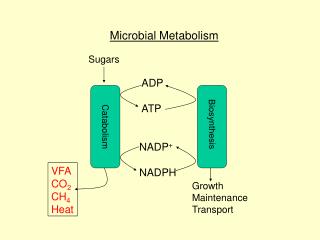
Energy density 218 kJ/100 g 157 kJ/100 g 188 kJ/100 g
Rice Bubbles vs CocoPops have the same energy density and similar nutrient content Replacing starch with sugar doesn’t alter energy density Added sugars have no impact on micronutrient density of breakfast cereals
Beer Wine and spirits Refined starches Maltodextrins Gluten Mostly empty calories… Refined oils Refined grains white rice Low fat, low sugar snacks Crispbreads Cakes and biscuits Other sources of empty calories
“Several dietary metrics that are currently emphasized, such as fat content, energy density, and added sugars, would not have reliably identified the dietary factors that we found to be associated with long term weight gain” Mozzafarian et al. NEJM 2011
Potato products had strongest link to weight gain Mozzafarian et al. NEJM 2011
Soft drinks and fruit juices Mozzafarian et al. NEJM 2011
Observational studies don’t prove causality, merely an association Randomised controlled trials RCTs are the “gold standard”
“The equivocal evidence on this topic makes it difficult to draw firm conclusions regarding the role of SSB in the etiology of obesity. Many of the prospective and experimental studies are of unsatisfactory methodological rigor” Mark Pereira Int J Obesity 2006
“The quantitative meta-analysis and qualitative review found that the association between sugar-sweetened beverages and BMI was near zero, based on the current body of scientific evidence” Forshee et al. Am J Clin Nutr 2008
Forshee’s meta-analysis of RCTs Favours control Favours intervention Forshee et al. Am J Clin Nutr 2008
Observational studies suggest a possible relationship between sugar-sweetened beverages and body weight, but there is currently insufficient supporting evidence from RCT of sufficient size and duration Van Baak and Astrup Obesity Reviews 2009
The current evidence does not demonstrate conclusively that nutritively sweetened beverages have uniquely contributed to obesity or that reducing consumption will reduce BMI levels in general Mattes et al. Obesity Reviews 2010
Mattes’ forest plot of RCTsEffectiveness trials aimed at decreasing consumption “These results indicate that there is no statistically significant effect overall…it is unlikely that interventions of the types studied to date could produce more than 0.05 of a SD unit lesser BMI change…” Mattes et al. Obesity Reviews 2011
RCT by Ebbeling et al. 2006n = 103 adolescents, parallel design 25 wk intervention, achieved ~1000 kJ reduction in soft drink intake No significant difference D BMI Control group received no attention placebo
Change in BMI in each groupn = 103 adolescents, parallel design 25 wk intervention Control group Intervention group NS Baseline BMI Baseline BMI Ebbeling et al. Pediatrics 2006
The Carmen Study393 adults, parallel design, ad libitum low fat diet, 6 mth intervention, most foods provided D weight Saris, Astrup, Raben et al. Int J Obesity 2000
The Australian Paradox The observation that Australians appear to have reduced their intake of added sugars but the prevalence of obesity continues to rise But have we really reduced our intake of added sugars? Barclay and Brand-Miller Nutrients 2011
Apparent consumption of refined sucrose Source: Australian Sugar Industry
Apparent consumptionAll nutritive sweeteners 16% drop Source: FAO, Statistics 2009
Global comparisons Source: FAO Statistics, 2009
Soft drinks: nutritive vs ‘diet’ Drop = 64 million litres Source: Australian Beverage Council Ltd and Dr Gina Levy (Food Logic, personal correspondence), September 2009
Children are drinking less soft drink, flavoured water & electrolyte drinks % consuming Mean intake Source: Analysis of the 2007 Children’s Nutrition and Physical Activity Survey undertaken for the Australian Beverages Council by Flinders University (unpublished data)
BMI vs added sugars intakeKids Eat, Kids Play 2007 BMI Z-score Jimmy Louie et al. unpublished data Quintiles of added sugars intake
My concern Continuing emphasis on limiting added sugars may be counterproductive because added sugars are replaced with undesirable nutrients eg saturated fat, high GI starches, salt and alcohol
My take home messages Humans have always had a concentrated source of sweetness Sugar improves the palatability of nutritious, but bland foods Australians have reduced their intake of added sugars yet obesity has increased Meta-analyses of RCT consistently show no effect There is some evidence that sugar-sweetened beverages, not total added sugars, is associated with adult weight gain Dietary guidelines should be evidence-based
Limit sugary drinks and confectionery Not foods with added sugars