Download
1 / 22
220 likes | 313 Vues
The market for Personal Accounts. Matthew Wakefield. Outline for part 2. How much current disposable income would those not currently contributing to a private pension forego if they were to contribute 5% of their earnings in the band £5,035 to £33,540?

E N D
The market for Personal Accounts Matthew Wakefield
Outline for part 2 • How much current disposable income would those not currently contributing to a private pension forego if they were to contribute 5% of their earnings in the band £5,035 to £33,540? • How many not currently offered an employer pension might be brought into private pensions – perhaps often Personal Accounts – through the change in enrolment? • How much might these individuals build up in pensions through minimum default contributions?
How much disposable income foregone? • Take the most recent available year of data on incomes, pension contribution status and family circumstances • FRS, 2006/07 • Change pension contributions such that all those not in fact contributing to a pension make individual contributions of 5% on the on the band between £5,035 and £33,540 of earnings • Model how this affects current disposable income, given the tax, benefit and credit system. • Look at effect on average across the population, and also at how this varies across the income distribution
Income devoted to employee contribution • Contribute a proportion of a band of earnings • A key determinant of income taken is level of earnings • Take an individual earning £33,540 with no other income • Contributes 0.05*(33,540 – 5,035) = £1,425 • 20% is tax relief, reduction in income: 0.8*£1,425 = £1,140 • This is 3.4% of the £33,540 gross income • Disposable income – net of income tax and NI – would have been £24,561 w/o the pension contribution • £1,140 is 4.6% of disposable income • This is the biggest ‘loss’ somebody could have • No interaction with higher-rate income tax or benefit withdrawal • Lowest income on which one could pay 5% of the whole band
Income devoted to employee contribution • Take an individual earning £7,885.50 (one-tenth of the way from £5,035 to £33,540) with no other income • Contributes 0.05*(7,885.5-5,035) = £142.5 • Contribution less tax relief is £114 • This is 1.4% of gross income, 1.6% of disposable income • Take an individual earning £60,000 with no other income • Contributes 0.05*(33,540 – 5,035) = £1,425 • 40% tax relief, reduction in income: 0.6*£1,425 = £855 • This is 1.4% of gross income, 2.1% of disposable income • Level of earnings a major determinant of proportion of disposable income accounted for by contribution
Income devoted to employee contribution • Level of earnings a major determinant of proportion of disposable income accounted for by contribution • Amount of non-earned income will also matter • Contribution a proportion of earnings • No extra contribution for “other income”, but it is extra disposable • Example of higher-rate taxpayer also showed tax-rate matters • This is effective tax-rate, not just a distinction between basic- and higher-rates • Similar effect for those on steep taper of new tax credits • For such an individual, at least some of pension contribution “costs” only 41p of disposable, per pound of contribution, thus reducing the proportion of disposable that is foregone
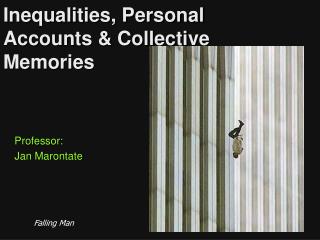
Proportion of disposable accounted for by 5% employee contribution from those not currently contributing Among families containing an “affected” individual Source: IFS Tax and Benefit model, TAXBEN, using data from 2006–07 Family Resources Survey.
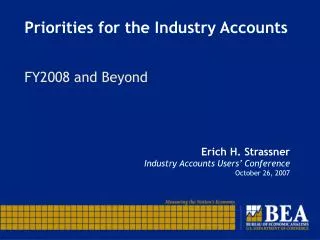
Proportion of disposable accounted for by 5% employee contribution from those not currently contributing Across all families Source: IFS Tax and Benefit model, TAXBEN, using data from 2006–07 Family Resources Survey.
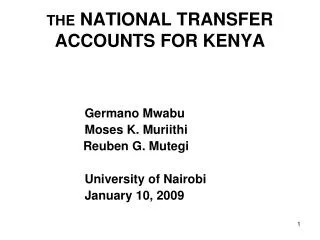
Proportion of disposable accounted for by 5% employee contribution from those not currently contributing Across all families Source: IFS Tax and Benefit model, TAXBEN, using data from 2006–07 Family Resources Survey.
How many might be automatically enrolled into Personal Accounts? • Examine one group who might have been enrolled into Personal Accounts in the past • Those not offered employer’s scheme • Excludes any whose employer might choose Personal Accounts when previously offering a different scheme • Also supposes employers that did not offer pension scheme in the past would now offer Personal Accounts • Think of the group identified as a group: • Relatively likely to be brought in to Personal Accounts • Who would be new to being offered pension through the workplace • Use BHPS data • Baseline year 2005, but also look at evolution 2001-05
Amount of default minimum contributions • How much would the group identified in 2005, have contributed over the period 2001 – 2005 • Default minimum contributions are 8% of earnings between £5,035 and £33,540 so can be computed straightforwardly • Assessing actual contributions would be much more complex • The amounts will be a reflection of the earnings distribution • … and of how this and group membership shifted over the period 2001-2005, for those identified in 2005
Conclusions (1) • Reforms to enrolment and default contributions to boost private pension coverage • Most not currently contributing to a private pension have lower earnings • Pounds increase in contributions will be small • Majority not contributing to a private pension do not have positive liquid wealth • Reshuffling small but some to repay debts less quickly? • Is a pension the best savings vehicle for them?
Conclusions (2) • Default minimum employee contribution to reduce disposable income by 0.5% • Number brought in to Personal Accounts likely to increase quickly • Although also a persistent group of defaultees • Some would have saved in a private pension without the reform • Among those not offered an employer’s pension scheme in 2005: • Aggregate contributions £4.2 billion from 4.7 million individuals • Median contributions of £770 • Over 2001-05, median contributions of £2,170
Amounts and Accounts:Reforming Private Pension Enrolment Carl Emmerson and Matthew Wakefield Institute for Fiscal Studies