Download
1 / 115
1.18k likes | 1.92k Vues
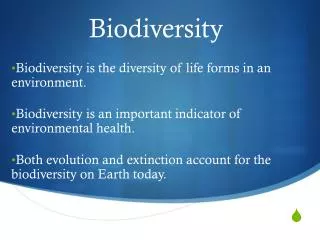
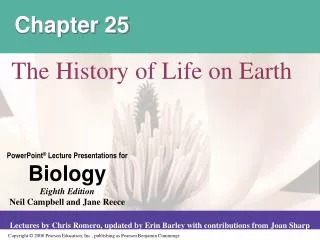
Chapters 25 and 26: history and diversity of life on Earth. Ch. 25: History of Life on Earth. Figure 25.1. How do we know so much about dinosaurs? What can we tell about them?. Figure 25.UN01. Cryolophosaurus skull. Concept 25.1: Conditions on early Earth made the origin of life possible.

E N D
Figure 25.1 How do we know so much about dinosaurs? What can we tell about them?
Figure 25.UN01 Cryolophosaurus skull
Concept 25.1: Conditions on early Earth made the origin of life possible Chemical and physical processes on early Earth may have produced very simple cells through a sequence of stages: 1. Abiotic synthesis of small organic molecules 2. Joining of these small molecules into macromolecules 3. Packaging of molecules into protocells 4. Origin of self-replicating molecules © 2011 Pearson Education, Inc.
Synthesis of Organic Compounds on Early Earth Earth formed about 4.6 billion years ago, along with the rest of the solar system Bombardment of Earth by rocks and ice likely vaporized water and prevented seas from forming before 4.2 to 3.9 billion years ago Earth’s early atmosphere likely contained water vapor and chemicals released by volcanic eruptions (nitrogen, nitrogen oxides, carbon dioxide, methane, ammonia, hydrogen, hydrogen sulfide) © 2011 Pearson Education, Inc.
In the 1920s, A. I. Oparin and J. B. S. Haldane hypothesized that the early atmosphere was a reducing environment and could produce organics In 1953, Stanley Miller and Harold Urey conducted lab experiments that showed that the abiotic synthesis of organic molecules (amino acids) in a reducing atmosphere is possible © 2011 Pearson Education, Inc.
Amino acids have also been found in meteorites © 2011 Pearson Education, Inc. The key builiding blocks of life are not hard to come by • RNA monomers have been produced spontaneously from simple molecules • In water, lipids and other organic molecules can spontaneously form vesicles with a lipid bilayer • Adding clay can increase the rate of vesicle formation • Vesicles exhibit simple reproduction and metabolism and maintain an internal chemical environment • Resultprotocells
Figure 25.3 0.4 Precursor molecules plus montmorillonite clay Relative turbidity, an index of vesicle number 0.2 Precursor molecules only 0 40 60 0 20 Time (minutes) (a) Self-assembly 1 m Vesicle boundary 20 m (b) Reproduction (c) Absorption of RNA
Self-Replicating RNA and the Dawn of Natural Selection The first genetic material was probably RNA, not DNA RNA molecules called ribozymes have been found to catalyze many different reactions For example, ribozymes can make complementary copies of short stretches of RNA © 2011 Pearson Education, Inc.
Concept 25.2: The fossil record documents the history of life The fossil record reveals changes in the history of life on Earth © 2011 Pearson Education, Inc.
© 2011 Pearson Education, Inc. Video: Grand Canyon
Figure 25.4 Present Dimetrodon Rhomaleosaurus victor 100 mya 1 m 175 Tiktaalik 0.5 m 200 270 300 4.5 cm Hallucigenia Coccosteus cuspidatus 375 400 1 cm Dickinsonia costata 500 525 2.5 cm Stromatolites 565 600 1,500 Fossilized stromatolite 3,500 Tappania
Few individuals have fossilized, and even fewer have been discovered The fossil record is biased in favor of species that Existed for a long time Were abundant and widespread Had hard parts © 2011 Pearson Education, Inc.
How Rocks and Fossils Are Dated Sedimentary strata reveal the relative ages of fossils The absolute ages of fossils can be determined by radiometric dating A “parent” isotope decays to a “daughter” isotope at a constant rate Each isotope has a known half-life, the time required for half the parent isotope to decay © 2011 Pearson Education, Inc.
Figure 25.5 Accumulating “daughter” isotope Fraction of parent isotope remaining 1 2 Remaining “parent” isotope 1 4 1 8 1 16 1 2 3 4 Time (half-lives)
Radiocarbon dating can be used to date fossils up to 75,000 years old For older fossils, some isotopes can be used to date sedimentary rock layers above and below the fossil © 2011 Pearson Education, Inc.
The Origin of New Groups of Organisms Mammals belong to the group of animals called tetrapods The evolution of unique mammalian features can be traced through gradual changes over time © 2011 Pearson Education, Inc.
Figure 25.6 Key to skull bones Reptiles (including dinosaurs and birds) Articular Dentary Quadrate Squamosal OTHER TETRA- PODS †Dimetrodon Synapsids †Very late (non- mammalian) cynodonts Early cynodont (260 mya) Therapsids Cynodonts Temporal fenestra (partial view) Mammals Synapsid (300 mya) Hinge Later cynodont (220 mya) Temporal fenestra Hinges Hinge Therapsid (280 mya) Very late cynodont (195 mya) Temporal fenestra Hinge Hinge
The geologic record is divided into the Archaean, the Proterozoic, and the Phanerozoic eons The Phanerozoic encompasses multicellular eukaryotic life The Phanerozoic is divided into three eras: the Paleozoic, Mesozoic, and Cenozoic Concept 25.3: Key events in life’s history include the origins of single-celled and multicelled organisms and the colonization of land © 2011 Pearson Education, Inc.
Figure 25.7-1 Origin of solar system and Earth 4 Archaean B o i g l l a i o s n r s a e of y 3 Prokaryotes Atmospheric oxygen
Figure 25.7-2 Origin of solar system and Earth Animals Multicellular eukaryotes 4 1 Proterozoic Archaean B o i g l l a i o s n r s a e of y 2 3 Prokaryotes Single-celled eukaryotes Atmospheric oxygen
Figure 25.7-3 Meso- zoic Cenozoic Humans Paleozoic Colonization of land Origin of solar system and Earth Animals Multicellular eukaryotes 4 1 Proterozoic Archaean B o i g l l a i o s n r s a e of y 2 3 Prokaryotes Single-celled eukaryotes Atmospheric oxygen
Photosynthesis and the Oxygen Revolution Most atmospheric oxygen (O2) is of biological origin In the search for extraterrestrial life, it is our primary target of observation © 2011 Pearson Education, Inc.
Figure 25.8 1,000 100 10 1 Atmospheric O2 (percent of present-day levels; log scale) 0.1 “Oxygen revolution” 0.01 0.001 0.0001 4 3 2 1 0 Time (billions of years ago)
The early rise in O2 was likely caused by ancient cyanobacteria A later increase in the rise of O2 might have been caused by the evolution of eukaryotic cells containing chloroplasts © 2011 Pearson Education, Inc.
The First Eukaryotes Eukaryotic cells have a nuclear envelope, mitochondria, endoplasmic reticulum, and a cytoskeleton The oldest fossils of eukaryotic cells date back 2.1 billion years The endosymbiont theory proposes that mitochondria and plastids (chloroplasts and related organelles) were formerly small prokaryotes living within larger host cells An endosymbiont is a cell that lives within a host cell © 2011 Pearson Education, Inc.
Which was the first endsymbiotic component, chloroplasts or mitochondria?
Figure 25.9-1 Plasma membrane Cytoplasm DNA Ancestral prokaryote Nucleus Endoplasmic reticulum Nuclear envelope
Figure 25.9-2 Plasma membrane Cytoplasm DNA Ancestral prokaryote Nucleus Endoplasmic reticulum Nuclear envelope Aerobic heterotrophic prokaryote Mitochondrion Ancestral heterotrophic eukaryote
Figure 25.9-3 Plasma membrane Cytoplasm DNA Ancestral prokaryote Nucleus Endoplasmic reticulum Photosynthetic prokaryote Mitochondrion Nuclear envelope Aerobic heterotrophic prokaryote Mitochondrion Plastid Ancestral heterotrophic eukaryote Ancestral photosynthetic eukaryote
Key evidence supporting an endosymbiotic origin of mitochondria and plastids: Inner membranes are similar to plasma membranes of prokaryotes Division is similar in these organelles and some prokaryotes These organelles transcribe and translate their own DNA Their ribosomes are more similar to prokaryotic than eukaryotic ribosomes © 2011 Pearson Education, Inc.
The Cambrian Explosion The Cambrian explosion refers to the sudden appearance of a multitude of modern body designs (530 million years ago) first evidence of predator-prey interactions © 2011 Pearson Education, Inc.
Figure 25.10 Sponges Cnidarians Echinoderms Chordates Brachiopods Annelids Molluscs Arthropods PROTEROZOIC PALEOZOIC Ediacaran Cambrian 635 605 575 545 515 485 0 Time (millions of years ago)
The Colonization of Land Fungi, plants, and animals began to colonize land about 500 million years ago Vascular tissue in plants transports materials internally and appeared by about 420 million years ago Plants and fungi today form mutually beneficial associations and likely colonized land together © 2011 Pearson Education, Inc.
Arthropods and tetrapods are the most widespread and diverse land animals Tetrapods evolved from lobe-finned fishes around 365 million years ago © 2011 Pearson Education, Inc.
The history of life on Earth has seen the rise and fall of many groups of organisms The rise and fall of groups depends on speciation and extinction rates within the group Concept 25.4: The rise and fall of groups of organisms reflect differences in speciation and extinction rates © 2011 Pearson Education, Inc.
© 2011 Pearson Education, Inc. Video: Volcanic Eruption
© 2011 Pearson Education, Inc. Video: Lava Flow
Figure 25.14 Present Cenozoic Eurasia North America Africa 65.5 India South America Madagascar Australia Antarctica Laurasia 135 Millions of years ago Gondwana Mesozoic 251 Pangaea Paleozoic
Continental drift has many effects on living organisms A continent’s climate can change as it moves north or south Separation of land masses can lead to allopatric speciation © 2011 Pearson Education, Inc.
Mass Extinctions The fossil record shows that most species that have ever lived are now extinct At times, the rate of extinction has increased dramatically and caused a mass extinction, and is the result of disruptive global environmental changes © 2011 Pearson Education, Inc.
The “Big Five” Mass Extinction Events In each of the five mass extinction events, more than 50% of Earth’s species became extinct © 2011 Pearson Education, Inc.
Figure 25.15 1,100 1,000 25 900 800 20 700 600 15 Total extinction rate (families per million years): Number of families: 500 400 10 300 200 5 100 0 0 Mesozoic Cenozoic Paleozoic Era Q D P E O S C Tr J C P N Period 488 444 145 416 359 299 251 65.5 0 542 200
The Permian extinction defines the boundary between the Paleozoic and Mesozoic eras 251 million years ago This mass extinction occurred in less than 5 million years and caused the extinction of about 96% of marine animal species © 2011 Pearson Education, Inc.
A number of factors might have contributed to these extinctions Intense volcanism in what is now Siberia Global warming resulting from the emission of large amounts of CO2 from the volcanoes Reduced temperature gradient from equator to poles Oceanic anoxia from reduced mixing of ocean waters © 2011 Pearson Education, Inc.
Is a Sixth Mass Extinction Under Way? Scientists estimate that the current rate of extinction is 100 to 1,000 times the typical background rate Extinction rates tend to increase when global temperatures increase Data suggest that a sixth, human-caused mass extinction is likely to occur unless dramatic action is taken © 2011 Pearson Education, Inc.
Figure 25.17 Mass extinctions 3 2 1 Relative extinction rate of marine animal genera 0 1 2 0 2 1 1 2 3 4 3 Cooler Warmer Relative temperature
Figure 25.16 NORTH AMERICA Chicxulub crater Yucatán Peninsula