Download
1 / 22
220 likes | 371 Vues
Pathogen Reduction Dialogue Panel 3 PERFORMANCE STANDARDS AND STATISTICAL SAMPLING. Loren Lange Assistant Deputy Administrator Office of Public Health and Science May 7, 2002. WHAT WILL BE DISCUSSED?. History of Statistically Based Studies--Baselines

E N D
Pathogen Reduction DialoguePanel 3PERFORMANCE STANDARDS AND STATISTICAL SAMPLING Loren Lange Assistant Deputy Administrator Office of Public Health and Science May 7, 2002
WHAT WILL BE DISCUSSED? • History of Statistically Based Studies--Baselines • How Data from Baselines Studies Was Used to Develop Existing Performance Standards
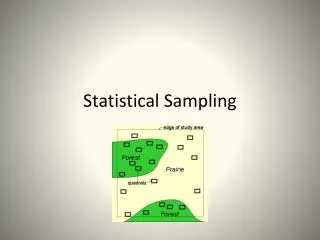
History of Statistically Based FSIS Microbiological Studies for Meat and Poultry Products
BACKGROUND • Microbiology Division Formed -- Mid ‘60’s • 1st Large Statistically Based Survey--1982-1984 (Single Organism) • Steer/Heifer Baseline Initiated--Oct. 1992 • Development of PR/HACCP Rule Begins--Fall 1994 • Standards Established--July 1996
ORIGINAL BASELINE OBJECTIVES • To Collect Data Which Provide a General Microbiological Profile of Product for Selected Microorganisms of Various Degrees of Public Health Concern • To Use the Information and Knowledge Gained From This Program As a Reference for Further Investigations and Evaluation of New Prevention Programs.
NEWER BASELINE OBJECTIVES • Support Risk Assessments - Required by 1994 Reorganization Act - Effective April 15, 1995 • Support Development of Standards - Baseline Data Used to Develop Standards Published in 1996
KEY DESIGN FACTORS • Nature and Number of Microorganisms • Desired Accuracy of Estimates (Number of Samples Required) • Cost and Laboratory Resources
BASELINE ORGANISMS • Pathogenic Organisms • Clostridium perfringens • Staphylococcus aureus • Listeria monocytogenes • Campylobacter jejuni/coli • Escherichia coli O157:H7 • Salmonella
BASELINE ORGANISMS(cont’d) • Indicator Organisms • Aerobic Plate Count @ 350 C • Total Coliforms • Generic Escherichia coli
NUMBER OF SAMPLES • Steer/Heifers Approx. 2,100 • Cows/Bulls • Market Hogs • Poultry Carcasses 1,200 - 1,300
ENSURED REASONABLE LEVELS OF PRECISION Product 95% Confidence Level Estimated Product Prevalence for Salmonella Market Hog 8.7 ± 1.18% Young Chicken 20.0 ± 2.16% Cow/Bull 2.7 ± 0.78%
How Were The Performance Standards Derived From Baseline Results?
FSIS Used the Estimated National Product Prevalence for Salmonella Product Percent - Young Chicken 20.0 - Cows/Bulls 2.7 - Steers/Heifers 1.0 - Market Hogs 8.7 - Ground Beef 7.5 - Ground Chicken 44.6 - Ground Turkey 49.9
The Baseline Prevalence is an Estimate of • the Percentage of Product that Would Test • Positive for Salmonella • The Baseline Prevalence Can Also Be • Viewed As the Probability That Any One • Sample Will Be Positive • FSIS Decided That Performance Would Be • Measured by a Series of Samples Referred • to As a Set of Size ‘n’.
When Sampling with Two Possible Outcomes (+/-), the Number of Positives x in n Independent Samples is said to Possess a Binomial Distribution where: • Probability (x positives) = (n!/[x!(n-x)!])pxqn-x • Where p is the Probability of a Positive (i.e.,Baseline Prevalence) and q=1-p
It follows that: Probability (c or fewer positives) = C positives • (n!/[x!(n-x)!])pxqn-x x = 1 Positive
FSIS Decided That an Establishment Operating at the Baseline Prevalence Should Have an 80% Probability of Passing • Selecting 80% Came From Balancing the Need to Prevent an Establishment From Failing Based on Chance Results and the Need to Identify Establishments Likely to be Operating Above the Prevalence
The Following Equation was then Solved for Different Combinations of c and n. C positives • (n!/[x!(n-x)!])pxqn-x = 0.80 x = 1 Positive Where p = baseline prevalence
Finally, FSIS Decided That n Needed to Be Greater Than 50 So That Sampling Would Measure Process Control Over Time • So the n and c in the Meat and Poultry Regulations Are the First Combination Where n>=50 and Probability (c or Fewer Positives)=0.8 Where the Probability of Any Single Positive Is the Baseline Prevalence.
OC CURVE • OC Curve Illustrates the Performance of a Particular Sampling Plan and the Risk of Both Types of Errors • OC Curve Shows the Likelihood of Passing at Different Levels of Prevalence
Baseline Prevalence (8.7 %)