Download
1 / 30
310 likes | 466 Vues
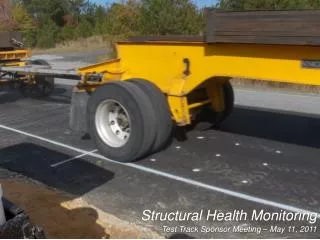
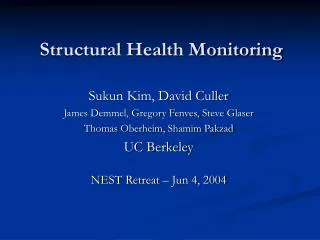
Forest Health Monitoring. Aerial survey. Annual ‘first cut’ at detecting and assessing forest health disturbances 15,545,310 acres surveyed in 2011 State, federal and private lands flown Nearly 75 hours of flight time Transect-based survey system used 4 to 6-mile wide transects

E N D
Aerial survey • Annual ‘first cut’ at detecting and assessing forest health disturbances • 15,545,310 acres surveyed in 2011 • State, federal and private lands flown • Nearly 75 hours of flight time • Transect-based survey system used • 4 to 6-mile wide transects • 2500 to 5000 ft. altitude • Digital Aerial Sketchmapping System (DASM)
DASM • Tablet PC • Customized GIS software • GPS-linked • High-resolution satellite imagery • Screen digitizing
Aerial Survey Results - 2011
Aerial survey • How the information is used • Annual reports to USFS • Outreach (e.g. Forest Health Highlights) • Prioritizing MDNR management activities • Aids with rapid response to potentially damaging agents • E.g. Compartment inventory pre-reviews
Gypsy moth defoliation MDNR forest compartments (current entry year in blue) Traverse City Management Unit EAB outliers with 5-mile buffer Forest tent caterpillar defoliation
National Insect & Disease Risk Map Project • Risk of mortality from major forest insect & disease agents • 25% or greater loss of standing live volume of trees over 1” DBH over the next 15 years • Forest health specialists provide biological input • GIS specialists run models and provide output for review
National Insect & Disease Risk Map Project Constructing the map • 180 Models employed • 46 I&D agents represented • Over 100 tree species included
National Insect & Disease Risk Map Project Jack pine budworm: Determining risk
Early Detection Surveys • Asian longhorned beetle • Hemlock woolly adelgid • Thousand Cankers Disease
16 PRD Surveyors Trained by MDNR Staged infestations Spring field trip to Clermont County, OH 35 State Parks 2 visits Leaf-on Leaf-off Ground surveys Binoculars Risk-based approach Parks stratified by: Host species Campsite proximity High-risk zip codes Tree decline Asian longhorned beetle
Hemlock woolly adelgid • Natural stands of hemlock • Proximity to 2010 finds • Emmet County • Ottawa County • HWA Hazard Zones • Elongate hemlock scale
Elongate hemlock scale • Armored scale introduced to U.S. in early 1900’s • Both HWA and EHS contribute to early stages of hemlock decline • Advanced stages of decline correlated with EHS but not HWA (where both occur) • Damaging outbreaks of EHS may be enabled by HWA feeding
Thousand Cankers Disease WTB larval galleries Walnut twig beetle, Pityophthorous juglandis Staining adjacent to galleries Coalescing cankers, Geosmithia sp
Thousand Cankers Disease • 30 walnut locations • Lower 3 tier of counties in Lower Peninsula • Walnut Council • Consultant foresters • Urban community forests • Walnut in proximity to mills • Visual surveys (decline) • Pheromone trapping