Download
1 / 32
340 likes | 550 Vues
Status, Trends, Distribution, and Functions of Wetlands in the New York City Water Supply Watershed. Laurie Machung, Bureau of Water Supply, Watershed Protection and Planning. Mapping and Research Programs. National Wetlands Inventory Wetlands Status and Trends

E N D
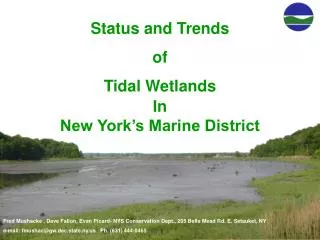
Status, Trends, Distribution, and Functions of Wetlands in the New York City Water Supply Watershed Laurie Machung, Bureau of Water Supply, Watershed Protection and Planning
Mapping and Research Programs • National Wetlands Inventory • Wetlands Status and Trends • Wetland Characterization and Preliminary Functional Assessment • Reference Wetlands Monitoring Program
National Wetlands Inventory (NWI) • USFWS first completed in 1996 using 1:58,000 scale mid 1980’s aerial photography • Updated in 2005 using 1:40,000 scale 2003 and 2004 aerial photography • Provides base data on the distribution, characteristics, and extent of wetlands
Wetland Status and Trends • Completed for the Croton Watershed in 1999, updated in 2005 • 1968 – 1984 • 1984 – 1994 • 1994 – 2004 • Completed for Catskill and Delaware 12/08 • Mid 80’s – mid 90’s • Mid 90’s – 2004
USFWS added LLW codes to each wetland polygon in theNWI database to depict: • Landscape Position • Lotic • Lentic • Terrene • Landform • Water flow path • Throughflow • Outflow • Isolated • Other modifiers (hw) Wetland Characterization
East of Hudson – 6 reference sites • West of Hudson – 22 reference sites • Water Quality • Water Table • Vegetation • Soils Wetlands Monitoring Program:
Croton Watershed Palustrine Wetlands Approximately 15,355 acres (6% of land surface)
Catskill/Delaware Watersheds Palustrine Wetlands Approximately 9,565 acres (1% of land surface)
Wetland Landscape Positions in East and West of Hudson Watersheds
Describes Wetland landscape settings • Enables an estimate of wetlands potentially lacking federal regulatory protection • SWANCC • Isolated wetlands • Rapanos and Carabel • Significant nexus analysis required for Non-navigable, non-relatively permanent tributaries and adjacent wetlands • To determine if they significantly affect the chemical, physical, and biological integrity of TNWs Wetland Characterization
Wetland Characterization • Used USFWS LLW codes to estimate abundance of wetlands lacking perennial connections • Two approaches • Water Flow path modifiers • IS, IN = isolated • OI, TI, OU = intermittent • Headwater modifiers • IN and IS = isolated • Headwater modifier - 1st and 2nd order streams
Croton Watershed Flow Path Method Predicts that 24% of wetlands are ‘vulnerable’ isolated (5%) intermittently connected (19%)
Croton Watershed Headwater Method Predicts that 43% of wetlands are ‘vulnerable’ Headwaters 38% Isolated 5%
Catskill/Delaware Watersheds Flow Path Method Predicts that 38% of wetlands are vulnerable isolated (13%) intermittently connected (25%)
Catskill/Delaware Watersheds Headwater Method Predicts that 71% of wetlands are ‘vulnerable’ Headwaters (58%) Isolated (13%)
Proportion of NWI Wetlands not included on NYS FWW Maps 21% 68%
Percent of Non-DEC wetlands without perennial connections 40% 68% 52% 70% (11%) (15%) (27%) (46%)
DOC vs Color: East of Hudson Wetland Outflows
Conclusions • According to the NWI, Wetlands occupy • 15,355 acres, or 6% of Croton Watershed • 9,565 acres, or 1% of the Catskill and Delaware Watersheds • Reference Wetland monitoring identified margin of error in NWI mapping • Net rates of wetland loss have declined over the time periods studied • Pond construction was leading cause of wetland loss in all time periods, though rates have declined
Conclusions • Based USFWS LLW modifiers, an estimated • 24% to 43% of Croton Watershed Wetlands and 38% to 71% of Catskill/Delaware Wetlands could lose federal protection and; • 11% to 15% of Croton Wetlands and 27% to 46% of Catskill/Delaware wetlands would lack federal or state protection
Conclusions • Reference wetland monitoring is a valuable tool to assess whether wetlands have a nexus to traditional navigable waters