Download

1 / 15
150 likes | 345 Vues
12.2 – Measures of Central Tendency. Measures of Central Tendency:. A single number to serve as a representative value around which all the numbers in the set tend to cluster. Sometimes it is referred to as a “middle” number of the data. Three types of measures of central tendency:.

E N D
12.2 – Measures of Central Tendency Measures of Central Tendency: A single number to serve as a representative value around which all the numbers in the set tend to cluster. Sometimes it is referred to as a “middle” number of the data. Three types of measures of central tendency: Mean (average) Median (middle) Mode (most)
12.2 – Measures of Central Tendency Mean The mean (arithmetic mean or average) of a set of data is found by adding up all the items and then dividing by the sum of the number of items. The mean of a sample is denoted by (read “x bar”). The mean of a complete population is denoted by (the lower case Greek letter mu). The mean of n data items x1, x2,…, xn, is given by the formula or
12.2 – Measures of Central Tendency Example: Ten students were polled as to the number of siblings in their individual families. The raw data is the following set: {3, 2, 2, 1, 3, 6, 3, 3, 4, 2}. Find the mean number of siblings for the ten students. siblings
12.2 – Measures of Central Tendency Weighted Mean The weighted mean of n numbers x1, x2,…, xn, that are weighted by the respective factors f1, f2,…, fn is given by the formula:
12.2 – Measures of Central Tendency Weighted Mean Listed below are the grades of a students semester courses. Calculate the Grade Point Average (GPA). 20 9 8 4
12.2 – Measures of Central Tendency Median Another measure of central tendency, is the median. This measure divides a group of numbers into two parts, with half the numbers below the median and half above it. The median is not as sensitive to extreme values as the mean. To find the median of a group of items: 1. Rank the items. 2. If the number of items is odd, the median is the middle item in the list. 3. If the number of items is even, the median is the mean of the two middle numbers.
12.2 – Measures of Central Tendency Example: Median Ten students in a math class were polled as to the number of siblings in their individual families and the results were: 3, 2, 2, 1, 1, 6, 3, 3, 4, 2. Find the median number of siblings for the ten students. Position of the median: 10/2 = 5 Between the 5th and 6th values Data in order: 1, 1, 2, 2, 2, 3, 3, 3, 4, 6 = (2+3)/2 Median = 2.5 siblings
12.2 – Measures of Central Tendency Median Example: Nine students in a math class were polled as to the number of siblings in their individual families and the results were: 3, 2, 2, 1, 6, 3, 3, 4, 2. Find the median number of siblings for the ten students. Position of the median: 9/2 = 4.5 The 5th value In order: 1, 2, 2, 2, 3, 3, 3, 4, 6 Median = 3 siblings
12.2 – Measures of Central Tendency Median in a Frequency Distribution Median Example: Find the median for the distribution. Position of the median is the sum of the frequencies divided by 2. (f) 23 = = Position of the median = 11.5 = 12th term 2 2 Add the frequencies from either side until the sum is 12. The 12th term is the median and its value is 4.
12.2 – Measures of Central Tendency Mode The mode of a data set is the value that occurs the most often. If a distribution has two modes, then it is called bimodal. In a large distribution, this term is commonly applied even when the two modes do not have exactly the same frequency Example: Ten students in a math class were polled as to the number of siblings in their individual families and the results were: 3, 2, 2, 1, 3, 6, 3, 3, 4, 2. Find the mode for the number of siblings. 3, 2, 2, 1, 3, 6, 3, 3, 4, 2 The mode for the number of siblings is 3.
12.2 – Measures of Central Tendency Mode in a Frequency Distribution Mode Example: Find the mode for the distribution. The mode in a frequency distribution is the value that has the largest frequency. The mode for this frequency distribution is 5 as it occurs eight times.
12.2 – Measures of Central Tendency Central Tendency from Stem-and-Leaf Displays The mean can be calculated from the data presented in a Stem-and-Leaf display. The median and mode are easily identified when the “leaves” are ranked (in numerical order) on their “stems.” Find the median and mode. Median: 21/2 = 10.5 11th term The median is 37. Mode is 42
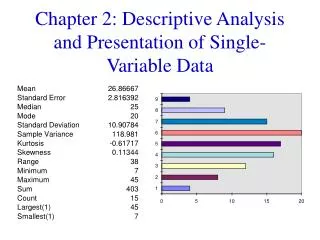
12.2 – Measures of Central Tendency Symmetry in Data Sets The analysis of a data set often depends on whether the distribution is symmetric or non-symmetric. Symmetric distribution: the pattern of frequencies from a central point is the same (or nearly so) from the left and right.
12.2 – Measures of Central Tendency Symmetry in Data Sets Non-symmetric distribution: the patterns from a central point from the left and right are different. Skewed to the left: a tail extends out to the left. Skewed to the right: a tail extends out to the right.