Download
1 / 19
210 likes | 407 Vues
Normal Distribution Curve. Something to think about… If we measured the right foot of several adults, what kind of histogram would you expect???. Normal Distribution Curve. Patterns tend to lead to formulas, right!?.

E N D
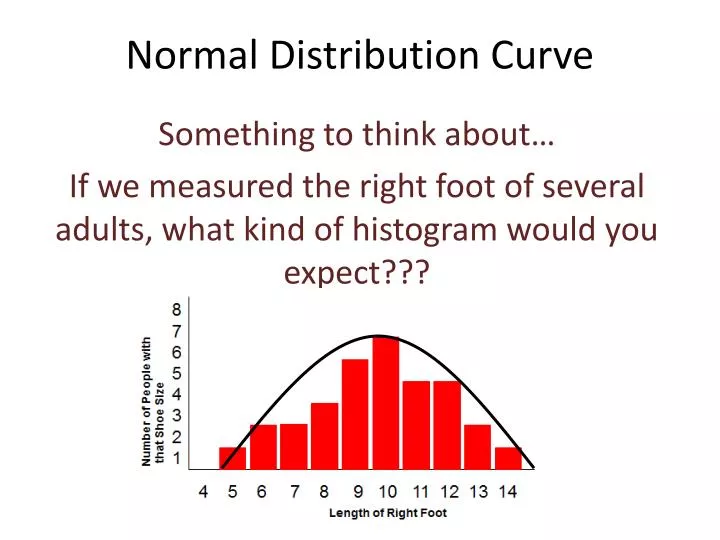
Normal Distribution Curve Something to think about… If we measured the right foot of several adults, what kind of histogram would you expect???
Normal Distribution Curve Patterns tend to lead to formulas, right!? Many things in our world end up with this bell-shaped pattern—where most people end up in the middle, and the # goes down on each side. Can you name some things that happen this way?
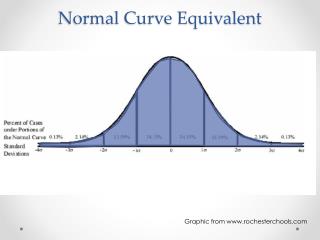
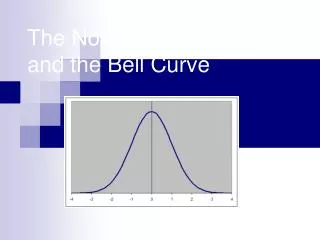
Normal curve • Mean of 0, standard deviation of 1 • Bell shape • Total area under the curve = 1 (100% of the people!!) • Mean = median=mode • 50% of the data is above the mean and 50% is below
Normal curve formula You will not be asked to recall this formula! I just wanted you to know that it exists!!!
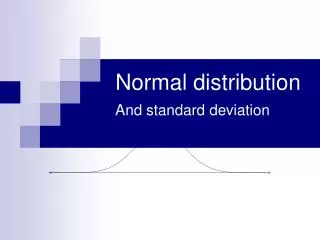
Normal distributions are a family of distributions that have the same general shape. They are symmetric with scores more concentrated in the middle than in the tails. Notice that they differ in how spread out they are. The area under each curve is the same.
Small Standard Deviation Large Standard Deviation The curves look different based on the standard deviation of the data!
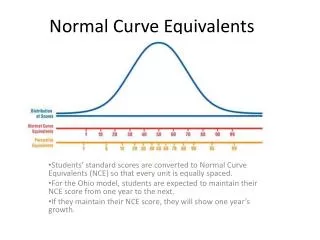
68% of the data 95% of the data 99.7% of the data Normal Distribution Curve The 68-95-99.7 Rule • Using the Normal Curve to solve problems.
If a survey of house prices was taken in the U.S. and they were NORMALLY DISTRIBUTED, what percent of the prices are within 2 standard deviations ofthe mean? 95%!
Household income is NORMALLY DISTRIBUTED with a mean of $50,000 and a standard deviation of $15,000.What percent of the population is within 1 standard deviation from the mean??What incomes are included in the 1 standard deviation range?? 68%! $35,000 to $65,000
Normal Curve Percentage Breakdowns 2.5% 34% 13.5% 2.5% 13.5% 34%
Adult women’s heights are normally distributed with a mean of 65.5 inches and a standard deviation of 2.5 inches. What percent of adult women have heights between 65.5 inches and 68 inches? 34% 58 60.5 68 63 65.5 70.5 73
Adult women’s heights are normally distributed with a mean of 65.5 inches and a standard deviation of 2.5 inches. What percent of adult women have heights greater than 70.5 inches? 2.5% 58 60.5 68 63 65.5 70.5 73
Adult women’s heights are normally distributed with a mean of 65.5 inches and a standard deviation of 2.5 inches. What is the percentage that a randomly selected adult woman will be less than 63 inches tall? 16% 58 60.5 68 63 65.5 70.5 73
Adult women’s heights are normally distributed with a mean of 65.5 inches and a standard deviation of 2.5 inches. What percent of adult women have heights less than 58 inches? 0.15% 58 60.5 68 63 65.5 70.5 73
Biology Test Scores are normally distributed with a mean of 75 and standard deviation of 8. What percent of students scored 75 or below? 50% 51 59 67 83 75 91 99
Biology Test Scores are normally distributed with a mean of 75 and standard deviation of 8. What percent of students scored 83 or higher? 16% 51 59 67 83 75 91 99
Biology Test Scores are normally distributed with a mean of 75 and standard deviation of 8. What percent of students made between 59 and 67? 13.5% 51 59 67 83 75 91 99
Things you need to know based on today’s notes: • The name “Normal Distribution Curves” • Bell shaped with mean=0 and standard dev=1 • Mean=mode=median • Percentages for 1 std deviation, 2 std deviations, and 3 std deviations • Sketch a normal curve with a small stddev and one with a large stddev • Sketch a normal curve with labeling • Use the 68-95-99.7 rule to solve problems.