Download

1 / 71
710 likes | 908 Vues
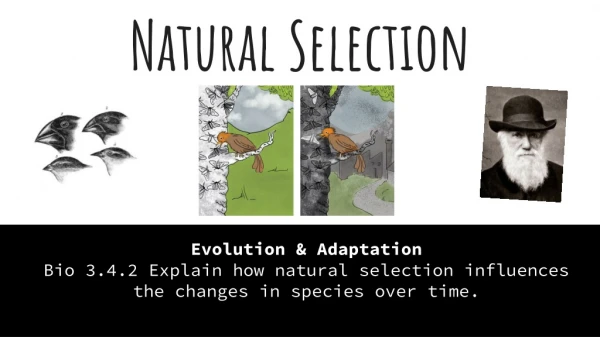
Natural Selection in Humans. Sharareh Noorbaloochi CS 374 Oct 10, 2006. Papers to be presented…. Science, 16 June 2006, Volume 312. PLoS Biology, March 2006, Volume 4. Overview. Pursuit of natural selection Biological Background Methods for detecting positive selection

E N D
Natural Selection in Humans Sharareh Noorbaloochi CS 374 Oct 10, 2006
Papers to be presented… Science, 16 June 2006, Volume 312 PLoS Biology, March 2006, Volume 4
Overview • Pursuit of natural selection • Biological Background • Methods for detecting positive selection • Genome-wide studies • From candidate to function
Adaptability of Modern Humans Humans have undergone tremendous cultural and environmental changes during the last ~40-50 KY. Spread around the world (migrate out of Africa 100KY) Global warming trend since last ice age ~14 KYA Transition from hunter to agricultural society (<~10KYA) Increase in pathogen load due to greater population density and proximity to livestock Voight et al. (2006)
Some Facts • In human beings, 99.9 percent of bases are the same. • Remaining 0.1 percent makes a person unique. • Different attributes / characteristics / traits • how a person looks, • diseases he or she develops. • These variations can be: • Harmless (change in phenotype) • Harmful (diabetes, cancer, heart disease, Huntington's disease, and hemophilia ) • Latent (variations found in coding and regulatory regions, are not harmful on their own, and the change in each gene only becomes apparent under certain conditions e.g. susceptibility to lung cancer)
Human Genetic Variations • Two types of genetic mutation events for today: • Single base mutation which substitutes one nucleotide for another • -- Single Nucleotide Polymorphisms (SNP) • Insertion or deletion of one or more nucleotide(s) • --Tandem Repeat Polymorphisms • --Insertion/Deletion Polymorphisms • Structural variations also important • (copy numbers) • One of the Most common type of genetic variation
What is SNP ? • A SNP is defined as a single base change in a DNA sequence that occurs in a significant proportion (more than 1 percent) of a large population. For example a SNP might change the DNA sequence AAGGCTAA ATGGCTAA.
SNP facts • SNPs are found in • coding and (mostly) noncoding regions. • Occur with a very high frequency • about 1 in 1200 bases on average. • approximately 10 million SNPs occur commonly in the human genome.
Allele • Allele: Any one of a number of viable DNA codings occupying a given locus (position) on a chromosome. • Usually alleles are DNA sequences that code for a gene, but sometimes the term is used to refer to a non-gene sequence. • In a diploid organism, like humans, one that has two copies of each chromosome, two alleles make up the individual's genotype.
Haplotype • Haplotype is a set of SNPs on a single chromatid that are statistically associated.
SNP Maps • Sequence genomes of a large number of people • Compare the base sequences to discover SNPs. • Generate a single map of the human genome containing all possible SNPs => SNP maps
The HapMap Project • The DNA samples for the HapMap come from a total of 270 people: • Yoruba people in Ibadan, Nigeria (30 both-parent-and-adult-child trios), • Japanese in Tokyo (45 unrelated individuals), • Han Chinese in Beijing (45 unrelated individuals), • CEPH (European) (30 trios). • These numbers of samples will allow the Project to find almost all haplotypes with frequencies of 5% or higher. • Ascertainment Bias (not enough samples to look at lower frequencies than 5%) http://www.hapmap.org/index.html.en
Hapmap, SNPs, Haplotype, Tag SNPs The construction of the HapMap occurs in three steps. • (a) Single nucleotide polymorphisms (SNPs) are identified in DNA samples from multiple individuals. • (b) Adjacent SNPs that are inherited together are compiled into "haplotypes." • (c) "Tag" SNPs within haplotypes are identified that uniquely identify those haplotypes. By genotyping the three tag SNPs shown in this figure, researchers can identify which of the four haplotypes shown here are present in each individual.
SNPs may / may not alter protein structure • Genetic variants that alter protein functions are usually deleterious less likely to become common or fixated. • Synonymous: AKA silent mutation, are mutations that have no functional affect on the protein. • Non-synonymous: amino acid-altering mutations sickle cell anemia • Degeneracy of Genetic Code Synonymous Non- Synonymous
How does human history affect genetic variation? A genome-wide survey of Linkage Disequilibrium Linkage disequilibrium is a phenomenon whereby genetic variants are associated: people who have one variant tend to have a second variant as well. Slide by: David Reich, Broad Institute
Emergence of Variations Over Time Mutation Common Ancestor present time Variation Over time Variations in Chromosomes Within a Population Slide by: David Reich, Broad Institute
Mutation 2,000 gens. ago 1,000 gens. ago What Determines Extent of LD? Time = present Recombination is the key! Slide by: David Reich, Broad Institute
Neutral Evolution Versus Positive Natural Selection
2 3 4 6 7 8 9 10 1 5 Neutral Evolution • Genetic Drift: slow process • Frequency of the neutral mutations in the population changes randomly. Generations Reproduced from Sabeti et al.
1 Positive Natural Selection • Positive Selection: • A selective regime that favors the fixation of an allele that increases • the fitness of its carrier. • Fixation: The process by which one allele increases in a population • until all other alleles go extinct and the locus becomes monomorphic. • Simply: 100% frequency. 2 3 4 6 7 8 9 10 5 Generations Reproduced from Sabeti et al.
Methods for detecting selection • Difference between species • High proportion of function altering mutations • Within-species variation • Low diversity • Excess of derived alleles • Differences between populations • Long unbroken haplotypes
Methods for detecting selection Test 1: Function altering mutations Age: many millions of years
Test 1: High proportion of function altering mutations Excess of function-altering mutations in PRM1 exon 2 • Over a prolonged period, positive selection can increase the fixation rate of beneficial function-altering mutations. • Signature detected by comparing rates of mutations • power limited: needs multiple selected changes before gene stands out from background neutral rate Synonymous mutation • Common Statistical test: • Ka/Ks test • Relative rate test • McDonald-Kreitman test P. C. Sabeti et al., Science 312, 1614 -1620 (2006)
Ka/Ks test (Li et al. 1985) • Main idea: Contrast two types of substitutions events. • Goal of the test: • calculate the synonymous rate (Ks) and the non-synonymous rate (Ka), at each codon site. • Purified (negative) selection: Ka decreases, Ka/Ks < 1 is indicative of purifying selection. • Positive Selection: Ka increases (replacement of amino acid is beneficial to the organism) Ka/Ks > 1
Within-species Tests Sweep Signatures • Test 2: Low diversity, many rare alleles (age < 250,000 years) • Test 3: Many high frequency derived alleles (age < 80,000 years) • Test 4: Long common haplotypes unbroken by recombination (age < 30,000 years)
Within-species Test 5: population Difference Age < 50,000 to 70,000 years Example 1 • Extreme population differences (PD) in FY*O allele frequency. • FY*O allele, which confers resistance to P. vivax malaria, is prevalent and even fixed in many African populations, but virtually absent outside Africa.
Genome-wide Studies New data sets make genome surveys possible • Full sequence for human, chimpanzee, mouse • Dense surveys of human genetic variation
Between-species results • Limited power to detect selection at single genes • Powerful for functional classes of genes rapidly changing: • Sperm-related genes • Olfactory (sense of smell) receptors
Finding selective sweeps • Statistical tests: • Distinguish the pattern of genetic variation expected under neutrality from that expected under natural selection • Pick a statistical test to detect sweeps • Apply the statistic across the genome
Finding selective sweeps • Problem • We do not fully know the shape of the neutral distribution and how it’s affected by other factors such as demographic history. • However, the best we can do: • use statistic based on simulations • apply it to empirical genome-wide data sets • Identify the loci in the extreme tail Most likely candidate of selection
Young alleles: • low frequency • long-range LD (long haplotypes) Old alleles: • low or high frequency • short-range LD Young alleles: • high frequency • long-range LD Test based on the relationship between allele frequency and extent of linkage disequilibrium No Selection Positive Selection Slide by: David Reich, Broad Institute
Positive Selection Neutrality The signal of selection Linkage Disequilibrium (Homozygosity) frequency Slide by: David Reich, Broad Institute
Methods for detecting selection Within-species Tests Test 2: Low genetic diversity/many rare alleles Age < 250,000 years
Test 2: Low genetic diversity/many rare alleles • As allele increases in population frequency variants at nearby locations • on the same chromosome (linked variants) rise in frequency. • Such so-called "hitchhiking" "selective sweep”. • Most common type of variant used: SNPs Low diversity and many rare alleles at the Kell blood antigen cluster • Common Statistical Test: • Tajima’s D • Hudson-Kreitman-Aguade (HKA) • Fu and Li’s D* P. C. Sabeti et al., Science 312, 1614 -1620 (2006)
Methods for detecting selection Within-species Tests Test 3: High-frequency derived alleles Age < 80,000 years
Test 3: Many high-frequency derived alleles • Derived alleles: non-ancestral alleles • Arise by new mutations • Typically lower allele frequencies than ancestral • However, in selective sweep, derived alleles linked to the beneficial alleles can hitchhike to high frequency. Figure: Excess of high-frequency derived alleles at the Duffy red cell antigen (FY) gene (34) P. C. Sabeti et al., Science 312, 1614 -1620 (2006)
Methods for detecting selection Within-species Tests Test 5: Differences between populations Age < 50,000 to 70,000 years
Test 5: Differences between populations • Geographically separate populations are subject to distinct environmental or cultural pressures change of allele frequency in one populations and not the other. • Can only arise when populations are at least partially isolated reproductively. • For humans, after the major human migrations out of Africa some 50,000 to 70,000 years ago. • Weakness of the test: similar to other population genetic signatures, distinguishing between genuine selection and the effect of demographic history (especially population bottleneck) on genetic variation can be hard. • Common Statistical Tests: • FST • Pexcess Reduction in size of a single, previously larger, population and a loss of prior diversity.
Extreme population Difference Example 1 • Extreme population differences (PD) in FY*O allele frequency. • FY*O allele, which confers resistance to P. vivax malaria, is prevalent and even fixed in many African populations, but virtually absent outside Africa.
Extreme population Difference • Example 2: • Region around LCT locus demonstrates large PD between Europeans and non-Europeans Strong selection for lactase persistence allele in Europeans. LCT
Genome-wide Survey using Tests: Low diversity and population separation Outliers: low diversity with high population differentiation
Methods for detecting selection Within-species Tests Test 4: Long Haplotypes Age < 30,000 years