Download
1 / 17
170 likes | 280 Vues
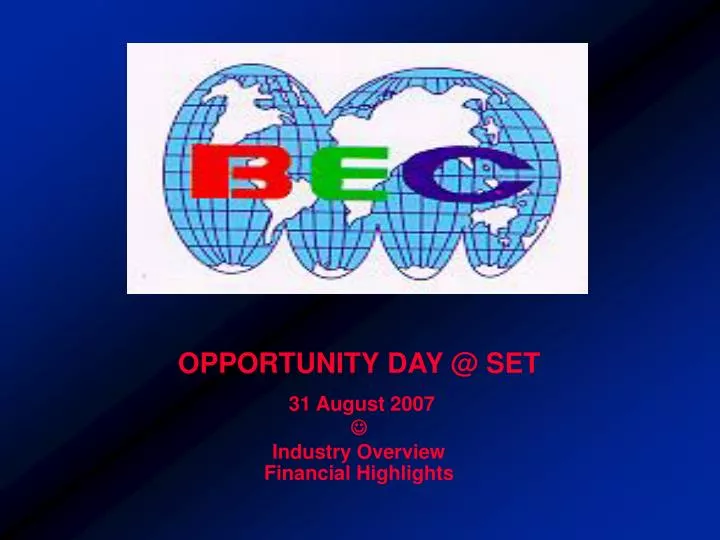
OPPORTUNITY DAY @ SET 31 August 2007 Industry Overview Financial Highlights. TV Advertising Trend:. High Growth Rate – Recovers Fast. Source: AGB Nielsen Media Research. TV ADEX-2003-2006. Source: AGB Nielsen Media Research. Advertising Expenditure Trends:.

E N D
OPPORTUNITY DAY @ SET 31 August 2007 Industry Overview Financial Highlights
TV Advertising Trend: High Growth Rate – Recovers Fast Source: AGB Nielsen Media Research
TV ADEX-2003-2006 Source: AGB Nielsen Media Research
Advertising Expenditure Trends: ESTIMATED TOTAL ADVERTISING EXPENDITURE BY MEDIUM 2Q (APRIL - JUNE) 07 VS 06 BAHT MILLIONS MEDIA 2Q 07 SOV% 2Q 06 SOV% DIFF % Change TV 12,694 57.25 13,936 60.85 (1,242) - 8.91 RADIO 1,662 7.50 1,730 7.55 (68) - 3.93 NEWSPAPERS 3,761 16.96 3,760 16.42 1 0.03 MAGAZINES 1,393 6.28 1,550 6.77 (157) -10.13 CINEMA 1,161 5.24 419 1.83 742 177.09 OUTDOOR 1,115 5.03 1,173 5.12 (58) - 4.94 TRANSIT 244 1.10 252 1.10 (8) - 3.17 IN STORE 144 0.65 84 0.37 60 71.43 TOTAL 22,174 100.00 22,904 100.00 (730) - 3.19 Source: AGB Nielsen Media Research
Advertising Spends on TV 2Q’07 vs 2Q’06 Baht:Millions -8.2% +6.3% +0.9% -26.5% -19.3% -27.2% Source: AGB Nielsen Media Research
Advertising Expenditure Trends: ESTIMATED TOTAL ADVERTISING EXPENDITURE BY MEDIUM 1H 07 VS 06 BAHT MILLIONS MEDIA 1H 07 SOV% 1H 06 SOV% DIFF % Change TV 25,452 56.76 26,299 60.17 (847) (3.22) RADIO 3,046 7.61 3,217 7.81 (171) (5.32) NEWSPAPERS 7,354 17.10 7,756 16.36 (402) (5.18) MAGAZINES 2,855 6.54 2,960 6.96 (105) (3.55) CINEMA 1,978 5.36 679 2.20 1,299 191.31 OUTDOOR 2,236 4.97 2,315 5.04 (79) (3.41) TRANSIT 417 1.01 468 1.12 (51) (10.90) IN STORE 266 0.65 118 0.35 148 125.42 TOTAL 43,604 100.00 43,812 100.00 (208) (0.47) Source: AGB Nielsen Media Research
Advertising Spends on TV 1H’07 vs 1H’06 Baht : Millions -2.9% +8.4% +2.5% -12.0% -16.5% -12.7% Source: AGB Nielsen Media Research
Top 20 Advertisers on Television 1H07: Source: AGB Nielsen Media Research Exclude Government and Music Spending:
Top 20 Advertisers on Television 1H07: Source: AGB Nielsen Media Research Exclude Government and Music Spending:
Top Gainers 1H’07 Source: AGB Nielsen Media Research
Top Losers 1H’07 Source: AGB Nielsen Media Research
STATION SHARE OF AUDIENCE 2006 - 2007 WHOLE KINGDOM : ALL AGED 4+ 06.00 - 24.00 POTENTIAL 2005 : 2006 : 59,400,000 ; 2007 :60,107,000 Source: AGB Nielsen Media Research
STATION SHARE OF AUDIENCE 2006 - 2007 WHOLE KINGDOM : ALL AGED 4+ 18.00 - 22.30 POTENTIAL 2005 : 2006 : 59,400,000 ; 2007 :60,107,000 Source: AGB Nielsen Media Research
2nd Quarter of 2007 Highlights: Net Earnings 588 8.7% 26.5%
BEC World 2Q07 Operating Results
High Operating Leverage: As our operating costs and expenses are mostly fixed in nature, thus BEC World has high operating leverage. Our profitability will improve greater than the growth rate of our revenue growth. Revenue and Profit Growth (1Q99 is BASE)