Download
1 / 6
60 likes | 207 Vues
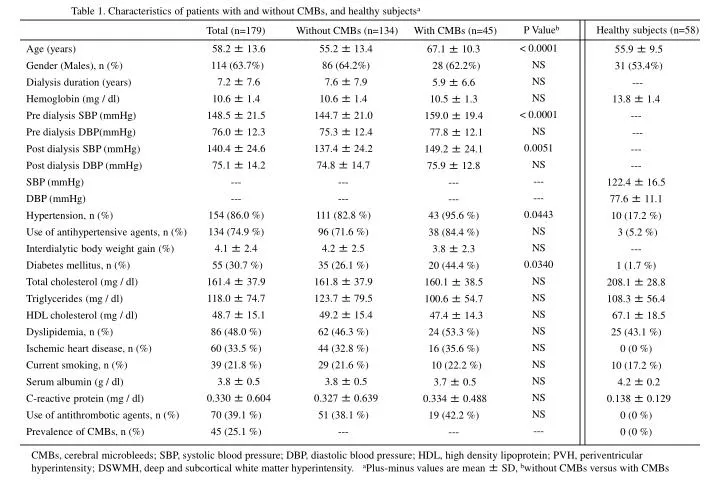
Table 1. Characteristics of patients with and without CMBs, and healthy subjects a. P Value b. Healthy subjects (n=58). Total (n=179). Without CMBs (n=134). With CMBs (n=45). 67.1 ± 10.3 28 (62.2%) 5.9 ± 6.6 10.5 ± 1.3 159.0 ± 19.4 77.8 ± 12.1 149.2 ± 24.1 75.9 ± 12.8 --- ---

E N D
Table 1. Characteristics of patients with and without CMBs, and healthy subjectsa P Valueb Healthy subjects (n=58) Total (n=179) Without CMBs (n=134) With CMBs (n=45) 67.1 ± 10.3 28 (62.2%) 5.9 ± 6.6 10.5 ± 1.3 159.0 ± 19.4 77.8 ± 12.1 149.2 ± 24.1 75.9 ± 12.8 --- --- 43 (95.6 %) 38 (84.4 %) 3.8 ± 2.3 20 (44.4 %) 160.1 ± 38.5 100.6 ± 54.7 47.4 ± 14.3 24 (53.3 %) 16 (35.6 %) 10 (22.2 %) 3.7 ± 0.5 0.334 ± 0.488 19 (42.2 %) --- < 0.0001 NS NS NS < 0.0001 NS 0.0051 NS --- --- 0.0443 NS NS 0.0340 NS NS NS NS NS NS NS NS NS --- 58.2 ± 13.6 114(63.7%) 7.2 ± 7.6 10.6 ± 1.4 148.5 ± 21.5 76.0 ± 12.3 140.4 ± 24.6 75.1 ± 14.2 --- --- 154 (86.0 %) 134 (74.9 %) 4.1 ± 2.4 55(30.7 %) 161.4 ± 37.9 118.0 ± 74.7 48.7 ± 15.1 86 (48.0 %) 60 (33.5 %) 39 (21.8 %) 3.8 ± 0.5 0.330 ± 0.604 70 (39.1 %) 45 (25.1 %) 55.2 ± 13.4 86 (64.2%) 7.6 ± 7.9 10.6 ± 1.4 144.7 ± 21.0 75.3 ± 12.4 137.4 ± 24.2 74.8 ± 14.7 --- --- 111 (82.8 %) 96 (71.6 %) 4.2 ± 2.5 35 (26.1 %) 161.8 ± 37.9 123.7 ± 79.5 49.2 ± 15.4 62 (46.3 %) 44 (32.8 %) 29 (21.6 %) 3.8 ± 0.5 0.327 ± 0.639 51 (38.1 %) --- Age (years) Gender (Males), n (%) Dialysis duration (years) Hemoglobin (mg / dl) Pre dialysis SBP (mmHg) Pre dialysis DBP(mmHg) Post dialysis SBP (mmHg) Post dialysis DBP (mmHg) SBP (mmHg) DBP (mmHg) Hypertension, n (%) Use of antihypertensive agents, n (%) Interdialytic body weight gain(%) Diabetes mellitus, n (%) Total cholesterol (mg / dl) Triglycerides (mg / dl) HDL cholesterol (mg / dl) Dyslipidemia, n (%) Ischemic heart disease, n (%) Current smoking, n (%) Serum albumin (g / dl) C-reactive protein (mg / dl) Use of antithrombotic agents, n (%) Prevalence of CMBs, n (%) 55.9 ± 9.5 31 (53.4%) --- 13.8 ± 1.4 --- --- --- --- 122.4 ± 16.5 77.6 ± 11.1 10 (17.2 %) 3 (5.2 %) --- 1 (1.7 %) 208.1 ± 28.8 108.3 ± 56.4 67.1 ± 18.5 25 (43.1 %) 0 (0 %) 10 (17.2 %) 4.2 ± 0.2 0.138 ± 0.129 0 (0 %) 0 (0 %) CMBs, cerebral microbleeds; SBP, systolic blood pressure; DBP, diastolic blood pressure; HDL, high density lipoprotein; PVH, periventricular hyperintensity; DSWMH, deep and subcortical white matter hyperintensity. aPlus-minus values are mean ± SD, bwithout CMBs versus with CMBs
Table 2. Univariate logistic regression analysis of factors associated with CMBs Univariate Variable P Unit Increase Odds Ratio (95% CI) Age 1 year Gender Dialysis duration 1 year Predialysis systolic blood pressure 1 mmHg Pre dialysis diastolic blood pressure 1 mmHg Postdialysis systolic blood pressure 1 mmHg Postdialysis diastolic blood pressure 1 mmHg Hypertension Use of antihypertensive agents Interdialytic body weight gain 1 % Diabetes mellitus Dyslipidemia Ischemic heart disease Current smoking Serum albumin 1 g / dl C-reactive protein 1 mg / dl Hemoglobin 1 g / dl Use of antithrombotic agents 1.092 (1.052 - 1.133) 0.919 (0.457 - 1.849) 0.967 (0.921 - 1.016) 1.037 (1.018 - 1.057) 1.017 (0.989 - 1.045) 1.020 (1.005 - 1.034) 1.006 (0.982 - 1.030) 4.455 (1.007 - 19.714) 2.149 (0.883 - 5.230) 0.939 (0.814 - 1.083) 2.263 (1.120 - 4.571) 1.327 (0.674 - 2.612) 1.129 (0.555 - 2.293) 1.034 (0.458 - 2.335) 0.751 (0.379 - 1.489) 1.020 (0.585 - 1.779) 0.970 (0.757 - 1.243) 1.189 (0.598 - 2.363) <.0001 .8133 .1873 .0001 .2423 .0066 .6298 .0490 .0919 .3839 .0228 .4125 .7382 .9350 .4126 .9440 .8098 .6207 Dummy variables were entered for gender (female = 0, male = 1), presence of CMBs (absent = 0, present = 1), hypertension (absent = 0, present = 1), diabetes mellitus (absent = 0, present = 1), dyslipidemia (absent = 0, present = 1), ischemic heart disease (absent = 0, present = 1), current smoking (non-smoker = 0, smoker = 1), use of antihypertensive agents (no = 0, yes = 1) and antithrombotic agents(no = 0, yes = 1).
Table 3. Multiple logistic regression analysis of factors associated with CMBs Model 3 Model 1 Model 2 Variable Odds Ratio (95% CI) Unit Increase Odds Ratio (95% CI) Odds Ratio (95% CI) Age 1 year Gender Dialysis duration 1 year Diabetes mellitus Dyslipidemia Ischemic heart disease Current smoking Serum albumin 1 g / dl C-reactive protein 1 mg / dl Hemoglobin 1 g / dl Use of antithrombotic agents Interdialytic body weight gain 1 % Pre dialysis systolic blood pressure 1 mmHg Pre dialysis diastolic blood pressure 1 mmHg Hypertension 1.100 ****(1.052 - 1.150) 0.758 (0.294 - 1.957) 1.001 (0.940 - 1.066) 1.522 (0.612 - 3.787) 1.190 (0.515 - 2.750) 0.834 (0.328 - 2.118) 1.477 (0.530 - 4.116) 1.442 (0.545 - 3.815) 0.888 (0.405 - 1.947) 1.091 (0.782 - 1.524) 0.787 (0.309 - 2.004) 0.982 (0.822 - 1.173) 1.037***(1.015 - 1.058) --- --- 1.117**** (1.066 - 1.170) 0.673 (0.266 - 1.701) 0.993 (0.935 - 1.053) 1.874 (0.761 - 4.619) 1.336 (0.583 - 3.062) 0.917 (0.362 - 2.322) 1.518 (0.562 - 4.104) 1.334 (0.515 - 3.457) 0.836 (0.387 - 1.852) 0.998 (0.724 - 1.376) 0.670 (0.270 - 1.665) 1.007 (0.850 - 1.194) --- 1.054** (1.016 - 1.094) --- 1.095 ****(1.052 - 1.141) 0.739 (0.300 - 1.824) 0.992 (0.935 - 1.053) 1.256 (0.516 - 3.053) 1.150 (0.513 - 2.582) 0.741 (0.300 - 1.833) 1.314 (0.497 - 3.474) 1.257 (0.499 - 3.167) 0.836 (0.397 - 1.762) 1.043 (0.759 - 1.433) 0.828 (0.344 - 1.994) 0.990 (0.835 - 1.173) --- --- 3.460 (0.707 - 16.917) R2 0.237**** 0.214**** 0.186*** Dummy variables were entered for gender (female = 0, male = 1), presence of CMBs (absent = 0, present = 1), diabetes mellitus (absent = 0, present = 1), dyslipidemia (absent = 0, present = 1), ischemic heart disease (absent = 0, present = 1), current smoking (non-smoker = 0, smoker = 1), hypertension (absent = 0, present = 1) and use of antithrombotic agents(no = 0, yes = 1). R2 ; coefficient of determination. **** P < 0.0001, ***P < 0.001, * *P < 0.01, * P < 0.05
Table 4. Multiple logistic regression analysis of factors associated with CMBs Model 6 Model 4 Model 5 Variable Odds Ratio (95% CI) Unit Increase Odds Ratio (95% CI) Odds Ratio (95% CI) Age 1 year Gender Dialysis duration 1 year Diabetes mellitus Dyslipidemia Ischemic heart disease Current smoking Serum albumin 1 g / dl C-reactive protein 1 mg / dl Hemoglobin 1 g / dl Use of antithrombotic agents Interdialytic body weight gain 1 % Post dialysis systolic blood pressure 1 mmHg Post dialysis diastolic blood pressure 1 mmHg Use of antihypertensive agents 1.102 ****(1.055 - 1.152) 0.725 (0.292 - 1.799) 0.999 (0.941 - 1.060) 1.674 (0.689 - 4.066) 1.168 (0.515 - 2.647) 0.741 (0.300 - 1.831) 1.181 (0.437 - 3.188) 1.440 (0.561 - 3.700) 0.864 (0.400 - 1.867) 1.071 (0.777 - 1.476) 0.836 (0.342 - 2.040) 1.037 (0.870 - 1.237) 1.023*(1.005 - 1.040) --- --- 1.129**** (1.073 - 1.188) 0.750 (0.302 - 1.863) 0.996 (0.938 - 1.058) 1.755 (0.721 - 4.276) 1.286 (0.563 - 2.938) 0.782 (0.313 - 1.951) 1.199 (0.440 - 3.272) 1.328 (0.519 - 3.395) 0.991 (0.462 - 2.124) 1.039 (0.749 - 1.441) 0.789 (0.323 - 1.928) 1.024 (0.860 - 1.221) --- 1.050** (1.015 - 1.086) --- 1.106 ****(1.059 - 1.155) 0.693 (0.281 - 1.705) 0.988 (0.932 - 1.047) 1.109 (0.439 - 2.801) 1.107 (0.492 - 2.493) 0.731 (0.297 - 1.804) 1.372 (0.517 - 3.644) 1.397 (0.548 - 3.560) 0.920 (0.439 - 1.926) 1.072 (0.774 - 1.486) 0.750 (0.309 - 1.821) 1.002 (0.846 - 1.186) --- --- 2.756 (0.932 - 8.149) R2 0.206**** 0.214**** 0.190*** Dummy variables were entered for gender (female = 0, male = 1), presence of CMBs (absent = 0, present = 1), diabetes mellitus (absent = 0, present = 1), dyslipidemia (absent = 0, present = 1), ischemic heart disease (absent = 0, present = 1), current smoking (non-smoker = 0, smoker = 1), hypertension (absent = 0, present = 1), use of antithrombotic agents(no = 0, yes = 1) and antihypertensive agents (no = 0, yes = 1). R2 ; coefficient of determination. **** P < 0.0001, ***P < 0.001, * *P < 0.01, * P < 0.05
Table 5. Prevalenceof cerebral small-vessel diseases with and without CMBs P Valuea Total (n=179) Without CMBs (n=134) With CMBs (n=45) 29 (64.4 ) 38 (84.4 ) 35 (77.8 ) 45 (33.6 ) 41 (30.6 ) 49 (36.6 ) 74 (41.3 ) 79 (44.1 ) 84 (46.9 ) 0.0005 < 0.0001 < 0.0001 Lacunar infarcts, n (%) PVH , n (%) DSWMH , n (%) CMBs, cerebral microbleeds; PVH, periventricular hyperintensity; DSWMH, deep and subcortical white matter hyperintensity. awithout CMBs versus with CMBs
Table 6. Correlations between CMBs and other cerebral small-vessel diseases Unadjusted Adjusted* Variable P P Odds Ratio (95% CI) Odds Ratio (95% CI) 3.585 (1.766 - 7.276) 12.314 (5.077 - 29.866) 6.071 (2.767 - 13.323) Lacunar infarcts PVH DSWMH .0004 < .0001 < .0001 1.707 (0.764 - 3.814) 7.442 (2.919 - 18.974) 3.630 (1.567 - 8.410) .1921 < .0001 .0026 CMBs, cerebral microbleeds; PVH, periventricular hyperintensity; DSWMH, deep and subcortical white matter hyperintensity; 95% CI, 95% confidence interval. Dummy variables were entered for presence of CMBs (absent = 0, present = 1), lacunar infarcts (absent = 0, present = 1), PVH (absent = 0, present = 1 and DSWMH (absent = 0, present = 1). *Adjusted by age and gender