Download

1 / 22
220 likes | 329 Vues
Brant Liebmann - CIRES Jose A. Marengo CPTEC Brazil Dave Allured - CIRES Leila Carvalho - University of Sao Paulo Gary Bates - CIRES Carolina S. Vera - University of Buenos Aires Nick Bond - JISAO, Seattle, Washington David Gochis - NCAR Ileana Blade - University of Barcelona

E N D
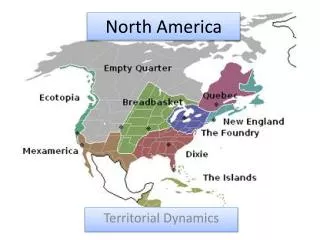
Brant Liebmann - CIRES Jose A. Marengo CPTEC Brazil Dave Allured - CIRES Leila Carvalho - University of Sao Paulo Gary Bates - CIRES Carolina S. Vera - University of Buenos Aires Nick Bond - JISAO, Seattle, Washington David Gochis - NCAR Ileana Blade - University of Barcelona Suzana Camargo - IRI, Palisades, New York Rong Fu - Georgia Tech Anji Seth - University of Connecticut North America - Better understand variations of wet season (1966 - 2001) South America - Compare observed precipitation with that from 24 member average of ECHAM 4.5 Atmospheric Model (1976-2001) Onset and End of the Wet Season in the Americas and comparisons with the ECHAM 4.5 Atmospheric General Circulation Model
We wish to thank the following agencies for providing the data used in this study: Agência Nacional de Águas (Brasil) Agência Nacional Energia Elétrica (Brasil) U.T.E. Uruguay C.T.M. Salto Grande Servicio Meteorologico Nacional (Argentina, Mexico, Paraguay, Uruguay) FUNCEME (Ceará, Brasil) U.S. National Climatic Data Center IAPAR - SIMEPAR (Paraná, Brasil) DAEE (São Paulo, Brasil) Minesterio del Ambiente y los Recursos Naturales (Venezuela) Meteorogische Dienst Suriname METEO-France ASANA (Bolivia)
A = ‘Anomalous Accumulation’ R = daily rainfall = Annual daily average
length start end
May - September Total Precipitation correlation
Compare Observed South American Precipitation with that from 24 member average of ECHAM 4.5 Atmospheric Model 1976-2001 Observations and model at same resolution ~ 2.8° x 2.8° Model: T42 horizontal; 19 vertical
Difference in Annual Total (model minus observations) What is the cause of the bias in annual totals?
Average Onset Date Jul Oct Apr Jan Jun Dec Feb Mar Nov Aug Sep May
Variance of Annual Total Explained: by Wet Season Length by Wet Season Rate OBSERVATIONS