Download
1 / 26
260 likes | 364 Vues
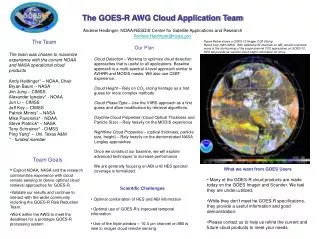
Performance of the NOAA AWG Cloud Height and Optical Properties Algorithms during SAAWSO. Andrew Heidinger, NOAA/NESDIS/STAR, Madison WI Andi Walther, CIMSS, Madison, WI. Outline. Algorithms Past Field Campaign Experience SAAWSO Results VIIRS Results What we can offer

E N D
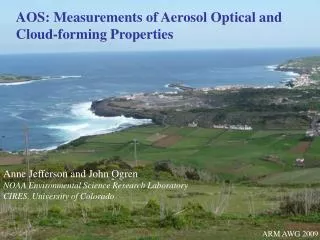
Performance of the NOAA AWG Cloud Height and Optical Properties Algorithms during SAAWSO Andrew Heidinger, NOAA/NESDIS/STAR, Madison WI Andi Walther, CIMSS, Madison, WI
Outline • Algorithms • Past Field Campaign Experience • SAAWSO Results • VIIRS Results • What we can offer • What we would like to do
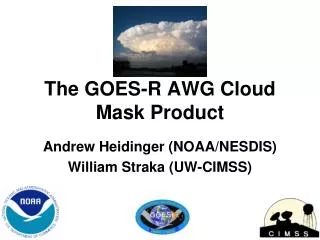
Cloud Detection Based on past experiences with trying to serve a common mask to multiple applications, we decided to maximize flexibility above all else. Our solution was to build a mask with multiple individual tests that could turned on and off by the downstream applications. This allows a common mask to be optimized. Individual tests were taken from various cloud masks developed by the team. Determination of test thresholds accomplished through an analysis of CALIPSO data. Output is a binary and 4-level mask similar to those today from NASA and NOAA. Naïve Bayesian formulation also used (Heidinger et al., 2012) Cloud Mask Overview 4 4 4 4
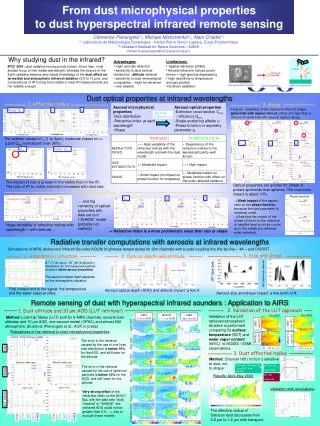
Algorithm uses the 11, 12 and 13.3 mm channels (IR only) for ABI but will operate on any 2 or 3 channel combinations of 6.7,8.5,11,12,13.3 mm. An optimal estimation approach and an analytical forward model are used to estimate cloud temperature, cloud emissivity and a cloud microphysical index. No predefined Lookup Tables. Cloud pressure and height are computed from NWP profiles. Special processing occurs in the presence of inversions. A multi-layer solution is performed for pixels typed as multi-layer. MTSAT version employs 6.7, 11 and 12 mm AWG Cloud Height Algorithm (ACHA) 5
AWG Cloud Height Algorithm (ACHA) Cloud Top Height Uncertainty (km) from Opitimal Estimation Cloud Top Pressure (hPa)
Optimal estimation approach taken from NESDIS operational heritage. ABI uses 0.65 mm and 2.2 mm reflectances. But 2nd channel can be 1.6, 2.1,3.75 or 3.9 mm. Optical depth and particle radius are estimated simultaneously. IWP and LWP are derived from optical depth and particle size. We implemented state-of-the-art scattering models and surface treatments that are consistent with those run by the MODIS products. We are also exploring interpretation of particle sizes using the 1.6, 2.2 and 3.9 mm observations. Daytime Cloud Optical and Microphysical Properties (DCOMP) 7 7 7 7
DCOMP Intra-Sensor Consistency Example • Cloud Optical Depth is in general in a good agreement between DCOMP on different sensors and the NASA Goddard MYD06 product. 8 8 8 8
GOES-12 Cloud Products for TORERO 2011/2012 TORERO = Tropical Ocean tRoposphere Exchange of Reactive halogen species and Oxygenated VOC TORERO was led by NCAR and and research flights flew from Central Chile and Costa Rica. We provided GOES-12 and GOES-13 results every 15 minutes from December, 2011 to March 2012 to the Data Catalog. Cloud Height information used in flight discussion/planning. Validation with UW/SSEC HSRL data is planned as part of supplemental AWG product validation.
GOES-13 Cloud Products for DC3 2012 DC3 = Deep Convective Clouds and Chemistry Experiment period: May-July 2012 Data is being provided since April 27, 2012 from ASPB/CIMSS. Validation with NASA Langley Dial/HSRL data and the University of Colorado SSFR (Solar Spectral Flux Radiometer) is also planned as part of supplemental AWG product validation.
ACHA and other AWG cloud products have found use in Field Campaigns. • Data is available in field catalogs of the 2012 TORERO and DC3 campaigns. • ACHA also used in the Hurricane and Severe Storm Sentinel (HS3) experiment. • ACHA cloud heights used to help estimate if a storm’s maximum cloud height exceeded the altitude range of the instrument drone aircraft. • Image on right is from HS3 HS3 2012 Image courtesy of S. Monette (CIMSS)
Example Validation Data from Field Campaigns: Comparison SFSR – DCOMP from GOES11 Validation with CalNex 2011 1. re from SFSR is representative for the whole cloud since its is a transmission measurement2. re from GOES needs the adiabatic adjustment (0.833) since its from the cloud top
Cloud Products for 14:15-20:45 February 20, 2013 • Cloud products generated every 30 minutes. (also provided to Bob Rabin) • Images show cloud-top temperature (upper right), cloud optical depth (lower left) and cloud particle size (lower right).
Cloud Products for February 20, 2013 Radar confirms absence of precipitation over SAAWSO for this period which offers a good validation of cloud properties. Cloud products (Water Path, Particle Size) can be used to estimate precipitation presence under the right conditions. Precipitation Estimate from Cloud Props Only Radar Image
Cloud Top Temperature Climatology over SAAWSO Region for January and February at 17:15 UTC. Period Mean
Introduction • Solar spectral irradiance is more than 8 orders of magnitude greater than moonlight spectral irradiance • ( 102W m2 sr-1 μm-1 vs. ~10-6 W m2 sr-1 μm-1 ) • Current sensors in visible spectrum are only able to detect signals around 100-102 W m2 sr-1 μm-1 • DNB is the first sensor which is both, highly sensitive in visible spectrum and providing a sufficient data depth (down to 10-5W m2 sr-1 as a band average with a 14bit resolution) • Spatial resolution is 700m. • DNB is collocated with VIIRS M-band channels.
VIIRS Nighttime Cloud Retrievals • When sufficient moon-light is present, a calibrated lunar reflectance can be computed. (Steve Miller, CSU). • This animation illustrates how inhomogeneous moon surface influences incoming TOA moon light reflectance • Full Moons During SAAWSO: December 28, 2012, January 26, February 25 and March 27 2013
The images show the traditional “Nakajima-King” plots for use of the 0.6 mm reflectance with the 3.75 mm reflectance (day) and 3.75 mm emissivity (night) • These curves indicate that the ability to retrieve both particle size and optical depth exists for wide range of clouds • These demonstrate the new ability to estimate large optical depths at night. VIIRS Low-Light Band Optical Depth Contours Optical Depth Contours Particle Size Contours Particle Size Contours
1:30 AM 1:30 PM VIIRS DNB Results VIIRS city lights GOES Missing
1:30 AM 1:30 PM VIIRS DNB Results When sufficient moon-light is present, VIIRS nighttime cloud optical depth are consistent with day-time. VIIRS GOES IR-only estimates of optical depth can not exceed 6-8.
What we can offer • 2013 GOES-13 results at 1km resolution • 2005-2013 GOES-13 Level-2 (4 km degree) results over a SAAWSO domain • 2005-2013 GOES-13 Level-2b (0.1 degree) results over a SAAWSO domain • 2013 VIIRS day and night results – Level-2 or 2b • MODIS and AVHRR products as needed.
What we are interested in • Validation of the VIIRS nighttime cloud depths, particle sizes and water paths. • Cloud base validation (all cloud types). • Precipitation impacts and our ability to detect them. • Mixed-phase clouds and phase inconsistency from IR and VIS/NIR approaches.